.svg)
Find Out How Much Less You Actually Need to Invest.
Some locations quietly duplicate the reach you already have. Cross Visitation shows you which ones, so every pound of your expansion budget buys real, new coverage.

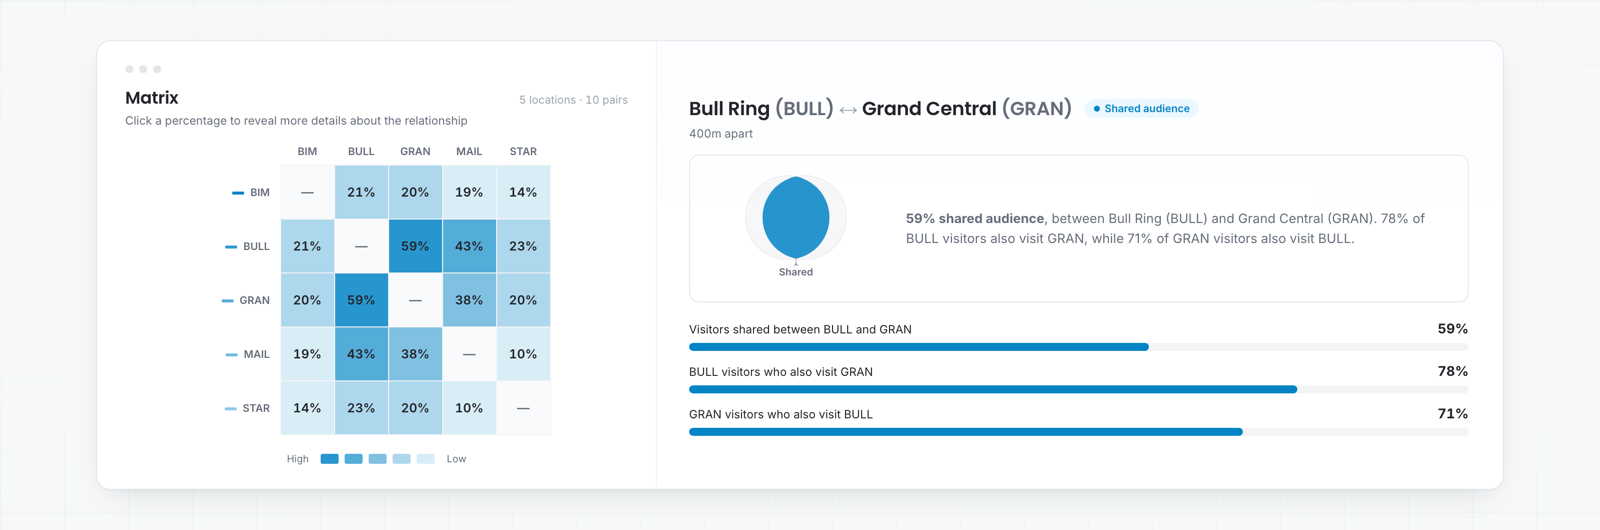
From two locations to one clear answer.
01
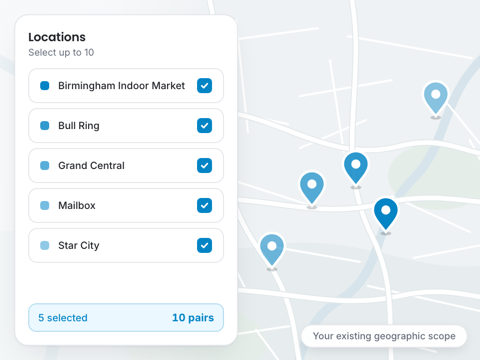
Pick your locations
Select up to 10 sites, stores, or competitor locations to compare, anywhere in your existing geographic scope.
02
We measure the overlap
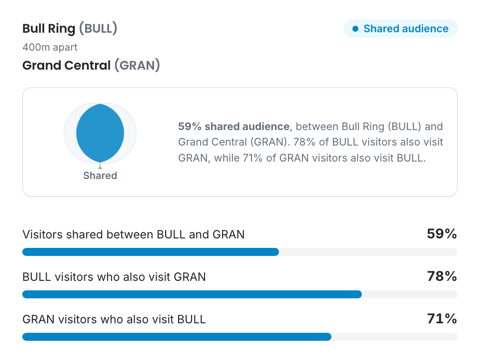
Using 12 months of opt-in visitation data, Huq calculates the share of visitors common to each pair, and the share unique to each.
03
Find unique opportunities
Every location is presented pair side by side, so the ones truly worth investing in are made clear and obvious.
Find the white space in your market.
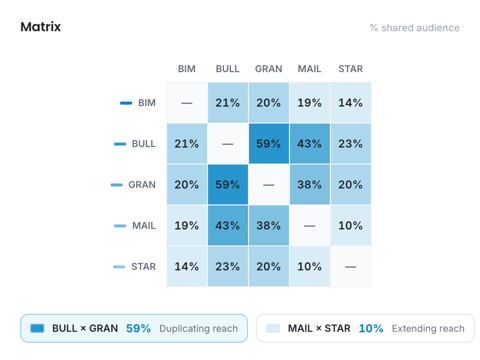
Test a location you don't yet occupy against your existing estate. Low overlap means real, untapped reach, not the same customers twice.
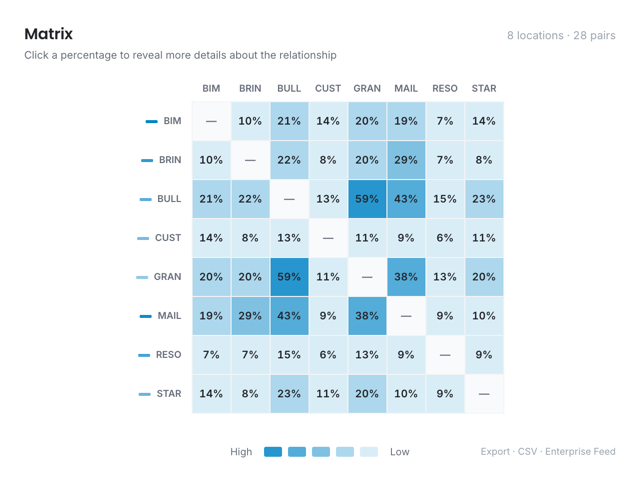
Compare up to 10 location pairs at once
See every pair in a single results matrix, no manual cross-referencing between exports.
A results matrix for all your location pairs at once
Validate a prospective site before you commit, low shared visitation with your estate means genuine white space
Answers grounded in a full year of trend data, not a single snapshot
Find the dominant location, back it with proof.
Stress-tested across 100+ locations, from dense urban centres to topographically complex sites, and benchmarked against CAA airport passenger origin-destination data.
What's MAPE? Mean Absolute Percentage Error measures how far our estimates typically sit from the real, observed figure. A 2% MAPE means our results are, on average, within 2% of ground truth, so lower is better.
.svg)

.svg)