.svg)
Huq's cross-visitation shows how much of the audience is shared between shopping centres, malls and stores, so you can see where fewer stores could deliver the same reach before you commit capital.
Expansion and property teams are under pressure to prove every new store is worth the spend. Footfall counts show how busy each location is, but not whether two nearby malls serve the same shoppers or reach new ones. Without comparable overlap data, decisions worth millions come down to assumptions.
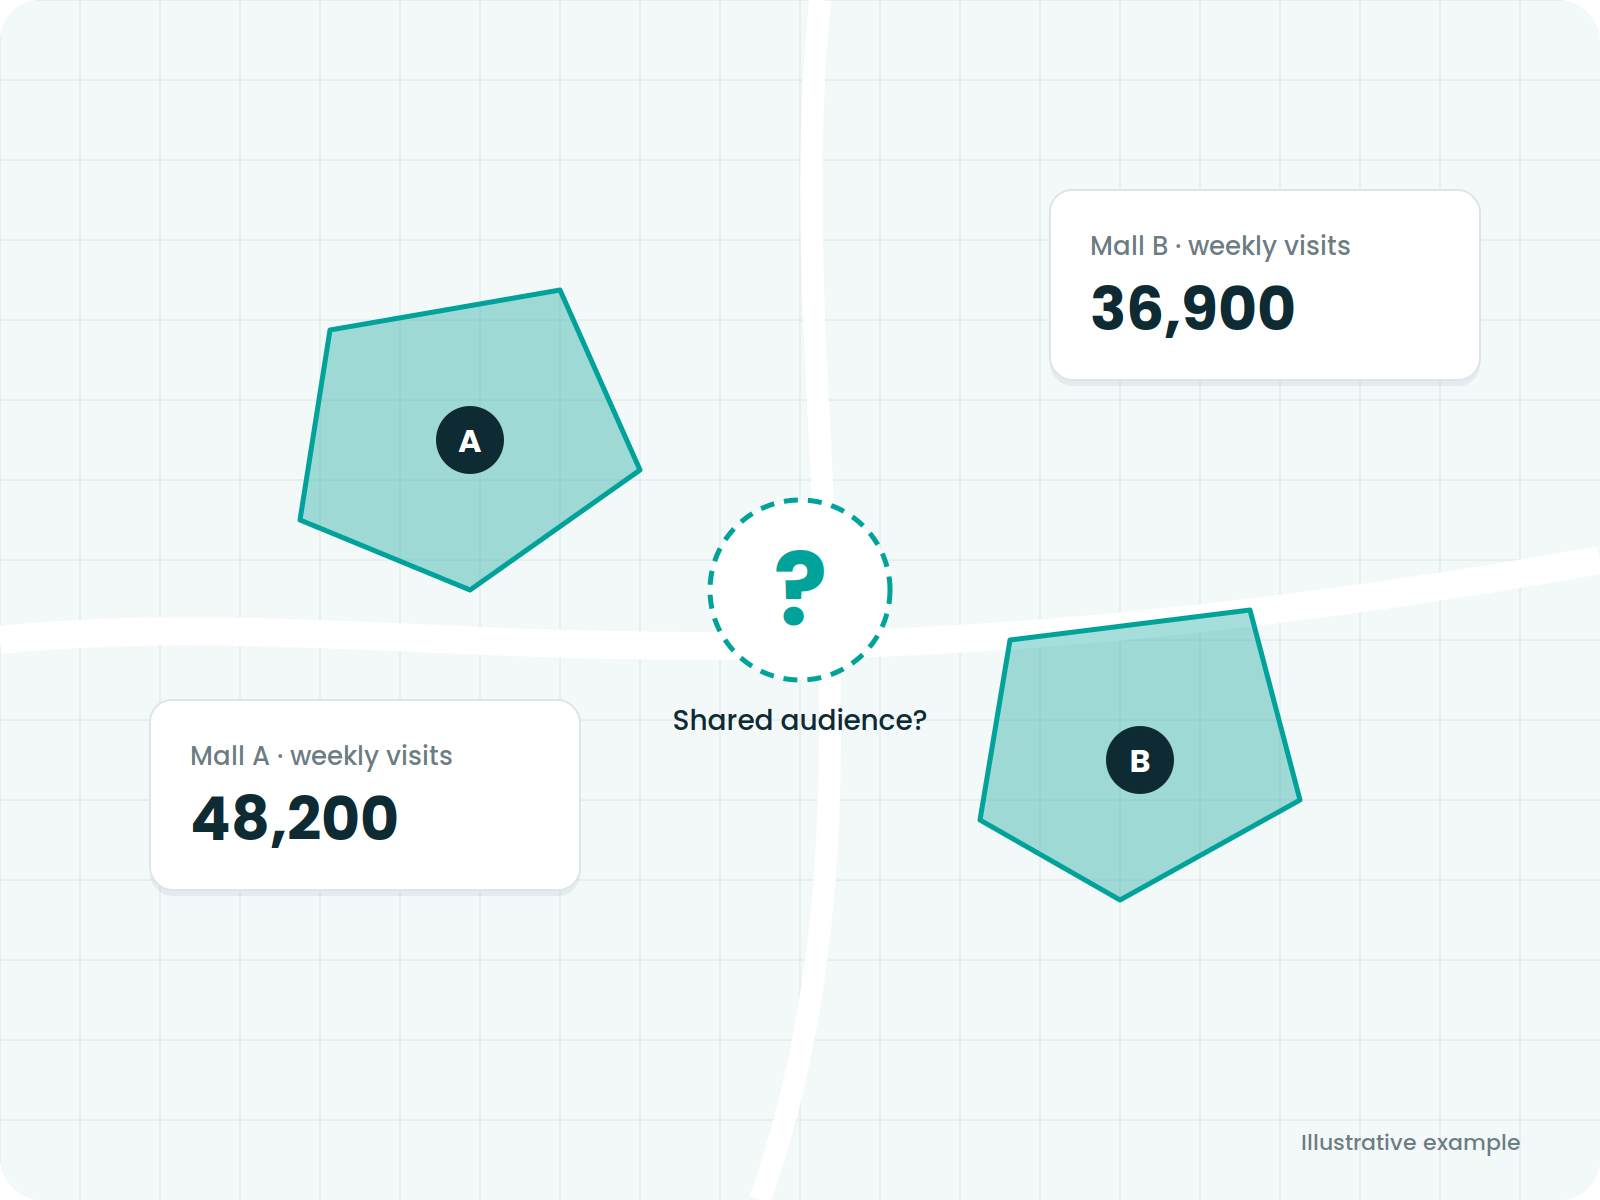
Compare visitor overlap across up to 10 location pairs at a time, from shopping centres and malls down to specific stores.
Find out what percentage of visitors to one location also visit another, and the overall degree of crossover between them.
Identify the locations that bring largely distinct footfall, so expansion spend goes on genuine new market coverage.
Give your CFO comparative data on shared and unique audiences across your target locations, rather than assumptions.
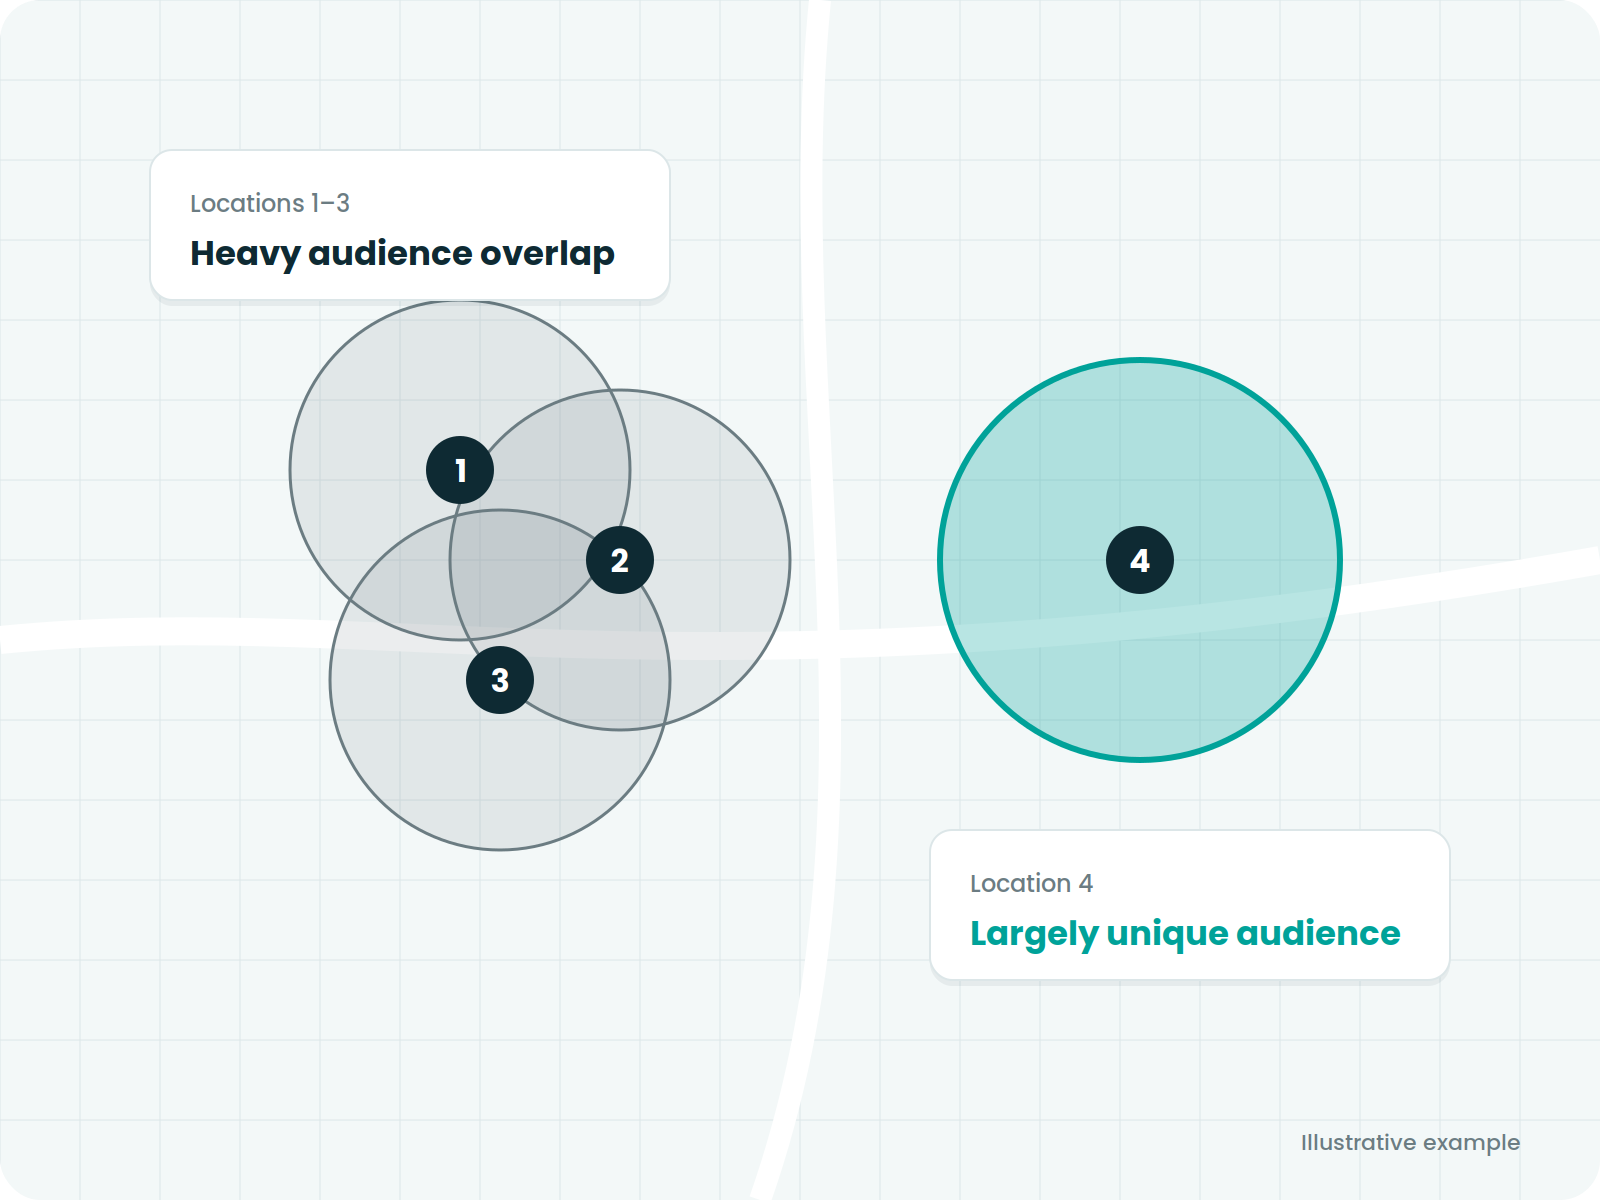
If two prospective locations largely share the same visitors, one store may deliver similar reach. With a new store costing up to £800k, that insight can save millions across a single target area.

Pinpoint the locations that reach a distinct audience, and put investment where it extends your reach rather than duplicating it.
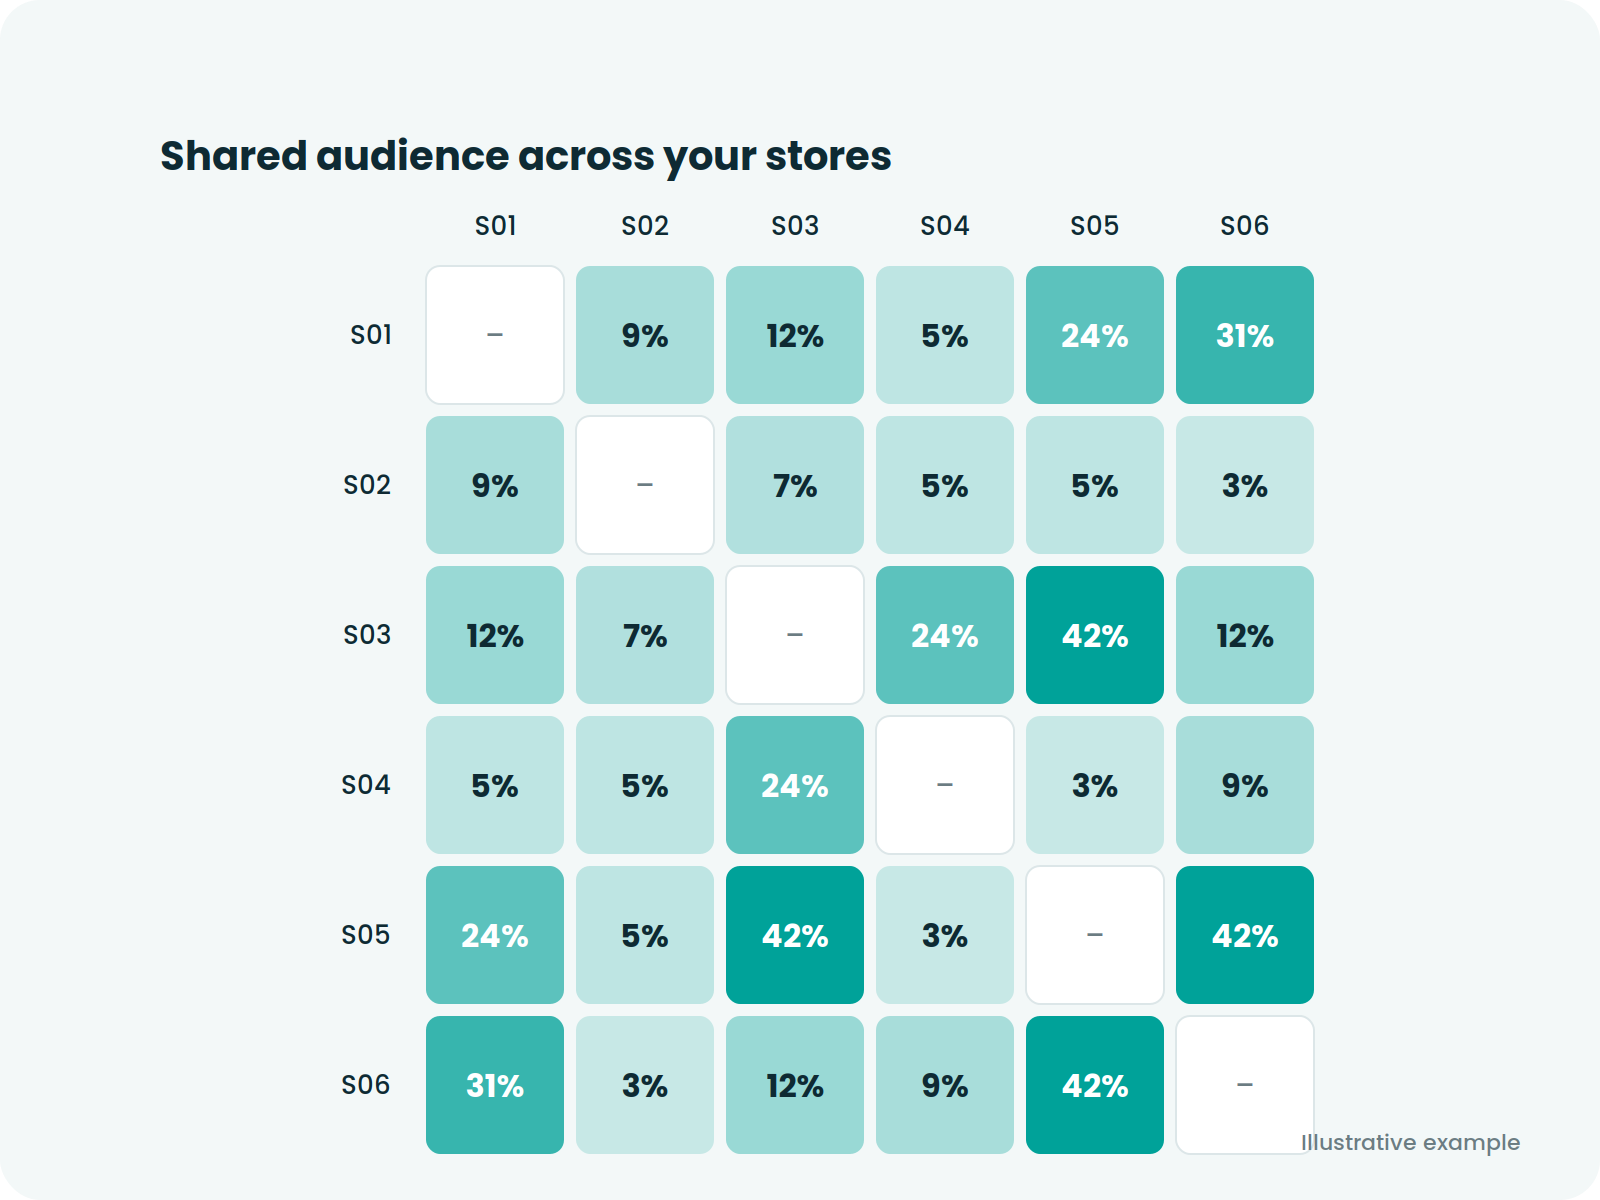
Check visitor overlap between your own stores, or other brands' locations, to see where your portfolio adds reach and where it overlaps.





%201.avif)





01
Choose the locations you're considering on the interactive map, using built-in mall and shopping centre boundaries.
02
Run comparisons for up to 10 location pairs at once and see the share of visitors common to each.
03
See the percentage of visitors to Mall A who also visit Mall B, and vice versa, with 12 months of trend data per result.
04
Weigh the overlap insight alongside your other commercial factors to decide where a new store adds genuine reach.
2%
MAPE against CAA airport origin-destination data
22
Active markets across the UK, Europe and beyond
300+
Companies using the Huq platform
huq brings together over a trillion data points huq movement, behaviour, spend, and context processed into a single, unified view of any location.
"huq's data has been a game-changer for us. The insights into footfall and visitor behaviour have given us the clarity we needed to optimise our retail strategy and make informed decisions."

Tom Haydney
UK Marketing & Product Manager
Kawai
"huq’s mobility data helps us to make better investment decisions and allows us to appropriately manage risk on behalf of our investor clients."
%201.avif)
Jonathan Bayfield
Head of UK Real Estate Research
Aviva Investors
"huq’s platform gave us valuable data to support a key decision on potential new sites."

Dan Brogden
National Sales Manager
Puccinos
Book a guided demo and we'll show you the visitor overlap between the locations you're considering.
.svg)
Empowering strategic teams with the world's most accurate and accessible location intelligence.
Contact

.svg)