.svg)
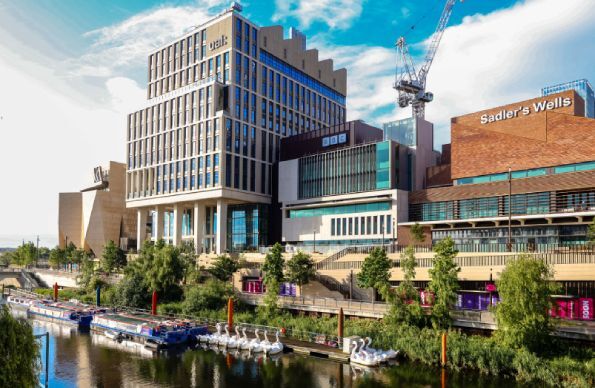
Transforming Queen Elizabeth Olympic Park
How the London Legacy Development Corporation used huq to validate investment, measure major events and plan Queen Elizabeth Olympic Park's future.

The Challenge
The London Legacy Development Corporation needed to quantify how new developments, infrastructure and major events affected Queen Elizabeth Olympic Park. Manual aggregation of stadium figures, cameras and scattered sensors was neither comprehensive nor reliable enough for stakeholder reporting or future investment decisions.
.svg)
Measure event impact
Capture visitor peaks across the whole park during major events rather than relying only on venue attendance figures.
.svg)
Validate investment
Demonstrate whether developments such as East Bank were strengthening the park's role as a destination.
.svg)
Improve stakeholder reporting
Provide credible evidence to the Mayor of London and other stakeholders to support future planning and funding.
The Solution
huq provided a live behavioural intelligence layer that unified movement trends, catchment visibility, and district benchmarking into a single platform.
.svg)
Movement Intelligence
Live visibility into visitor activity and engagement patterns.
.svg)
Catchment Analysis
Postcode-level insight into visitor origins and regional movement.

Economic Development
The function or strategy focused on growing the local economy.
Event Impact Measurement
Measure how events and interventions affect footfall, dwell time and visitor behaviour.
The London Legacy Development Corporation used huq to validate investment, measure major events and plan Queen Elizabeth Olympic Park's future.
huq provided location-based footfall data through huq Signals, enabling the LLDC to monitor visitor movement, footfall trends, dwell time and catchment areas across the park. Combining these insights with other geospatial evidence gave the team a more complete view of how the destination was changing.
Case study highlights
- Event measurement: Footfall could be compared across times of day, week and year, including major event weekends.
- Catchment insight: The team could distinguish local visitors from people travelling from farther afield.
- Dwell analysis: Visitor duration added context to footfall and helped assess engagement and commercial vitality.
- Evidence-led reporting: Reliable data replaced manual estimates and strengthened the case for future investment.
The partnership transformed how the LLDC captures and communicates visitor evidence, giving planners a clearer basis for prioritising future development.
Results & Operational Impact
With huq first clients achieve significantly stronger visibility into commercial demand, engagement growth, and estate performance.
.avif)
Faster leasing evaluations
Improved understanding of real-world commercial demand
Stronger investment confidence
Behavioural intelligence supported more evidence-led decisions
Improved district visibility
Teams benchmarked engagement across multiple locations
Better recovery tracking
Live movement signals replaced delayed reporting cycles

Related Case Studies

Challenger Coffee Brand Site Selection Case Study
A UK challenger coffee brand used huq's footfall data to identify high-potential sites, avoid oversaturated markets and outperform larger rivals.

How JD Sports Used Customer Catchments to Inform Outlet Expansion Strategies
huq's mobility location data enabled JD Sports to refine customer catchment analysis, optimise store network performance and make data-driven expansion decisions, reducing risk and enhancing strategic growth.
.svg)
Empowering strategic teams with the world's most accurate and accessible location intelligence.
Contact

.svg)