.svg)
UK Retail Parks – Week 19 Performance Update 2025: Insights Using Location Analytics
UK retail parks saw a modest 1.4% weekly rise with a 7.6% year‑on‑year decline. Subtle shifts in location analytics and retail performance metrics signal evolving trends.

May 22, 2025
2 min read
Table of contents
Overview
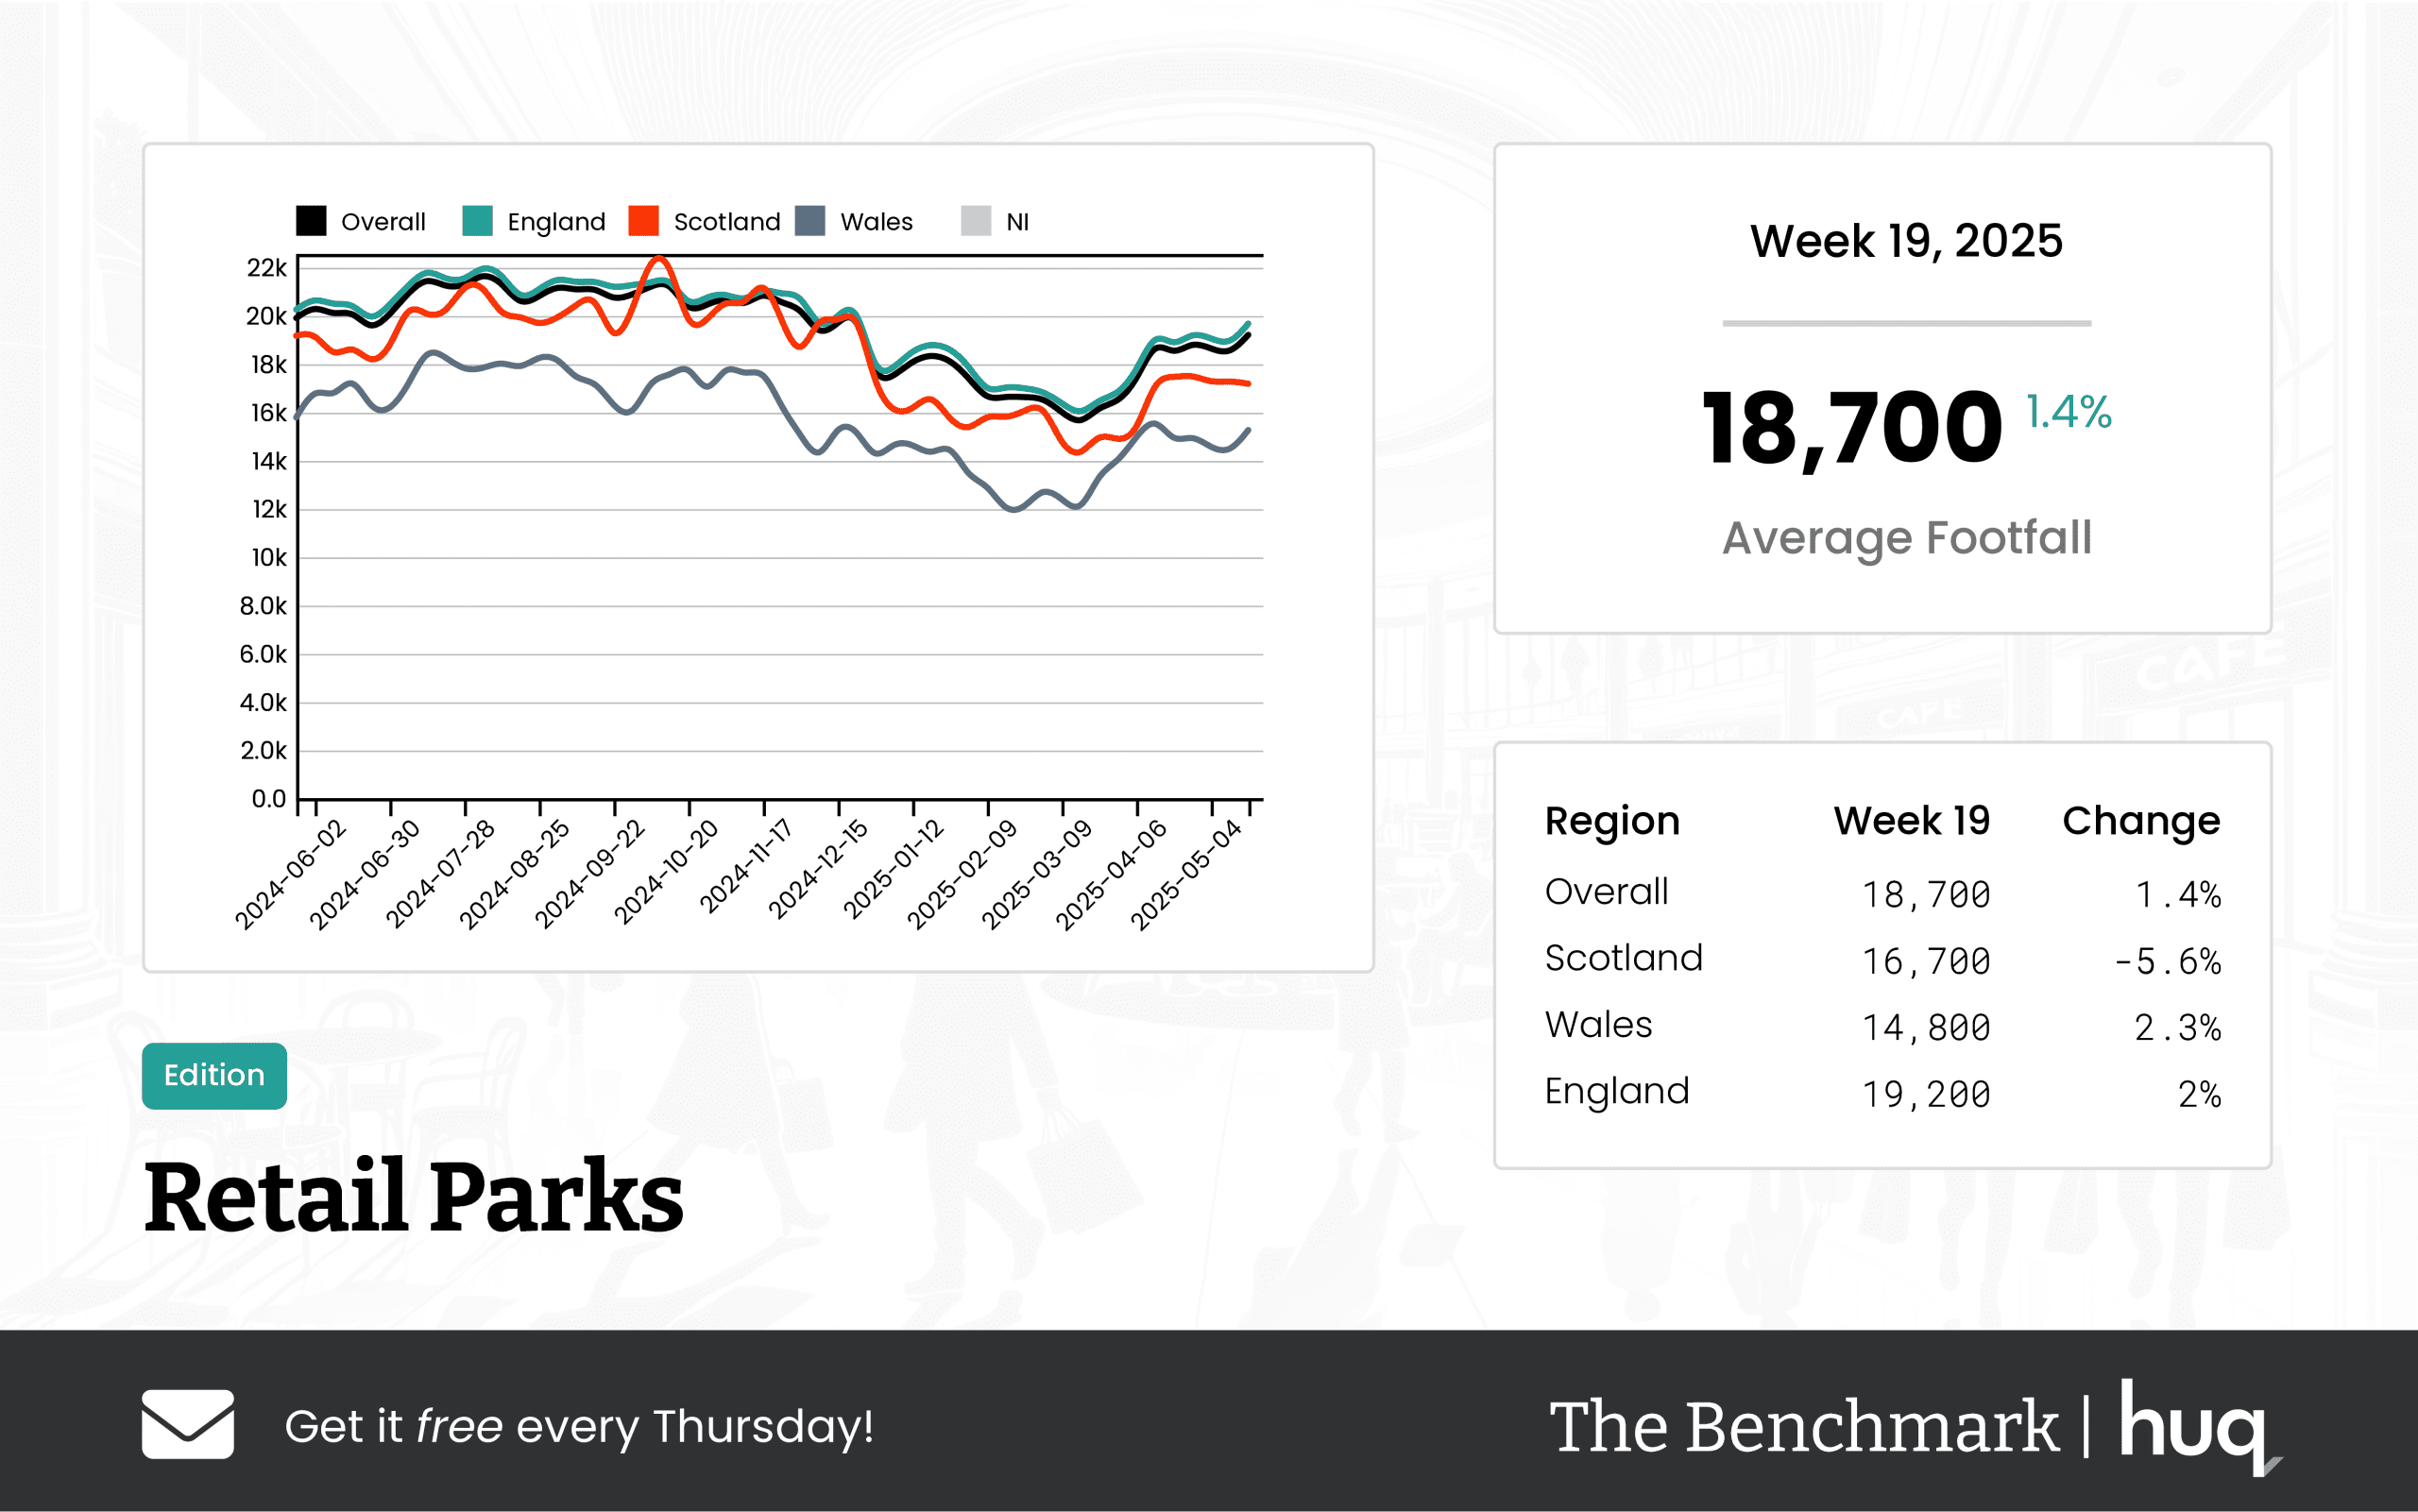
The latest results from The Benchmark reveal a mixed performance across UK retail parks. Location analytics indicate that the average daily footfall reached 18,700, marking a modest week‑on‑week increase of 1.4% but also a moderate year‑on‑year decline of 7.6%. While a slight recovery in visitor numbers signals potential short-term gains, the comparison with last year emphasizes a broader trend of subdued retail performance.
Regional Performance
A closer look at the region-specific data shows notable variations:
• In England, retail parks attracted an average of 19,200 visitors per day, with a stable weekly rise of 2% and a smaller year‑on‑year contraction of 6.7%.
• In Wales, although the average daily footfall was lower at 14,800, there was a positive weekly change of 2.3%, despite experiencing a larger year‑on‑year decline of 10.5%.
• Scotland reported an even lower average of 16,700 visitors per day, paired with a significant week‑on‑week softness of 5.6% and a steep year‑on‑year drop of 14.9%.
Dwell Time Analysis
Dwell time serves as a crucial secondary indicator of visitor engagement. Overall, visitors spent an average of 70 minutes per visit. When broken down by region:
• England saw a slight dip with an average of 69 minutes per visit and a weekly softness of 4.2%.
• Scotland observed a modest improvement with an average of 71 minutes per visit and a 4.4% weekly rise.
• Wales experienced a significant improvement, with dwell times reaching an average of 76 minutes per visit consistently, underscoring increased visitor engagement despite lower footfall figures.
Industry Insight
Joe Capocci, spokesperson for Huq Industries, noted, "The striking weekly softness in Scotland’s footfall, alongside the supportive retail developments noted recently, underscores the importance of monitoring these evolving trends." His comments highlight the critical need for businesses to closely track both footfall and dwell time metrics as part of their broader retail performance strategies.
The insights derived from these analytics provide a snapshot of the dynamic landscape of UK retail parks. With ongoing regional disparities, understanding the interplay between footfall and dwell time will be crucial as retailers and stakeholders strategize responses to modest growth and underlying declines.
Media: For all media and press enquiries, please contact media@huq.ioAbout Huq Industries
Huq Industries is the leading provider of location intelligence across the UK, Europe, and the Middle East, specialising in delivering high-quality data insights on footfall, consumer behaviour, and retail performance. By leveraging advanced analytics, Huq Industries enables retailers and analysts to understand and respond to market trends effectively, ensuring they are well-equipped to navigate the changing landscape of high street and town centre commerce.
Frequently Asked Questions
Clear answers to the most common questions about movement intelligence, retail expansion, and location analytics.
Related Blogs and Insights



.svg)
Empowering strategic teams with the world's most accurate and accessible location intelligence.
Contact

.svg)