.svg)
UK Retail Parks – Week 12 Performance Update 2025: Footfall Retail Insights
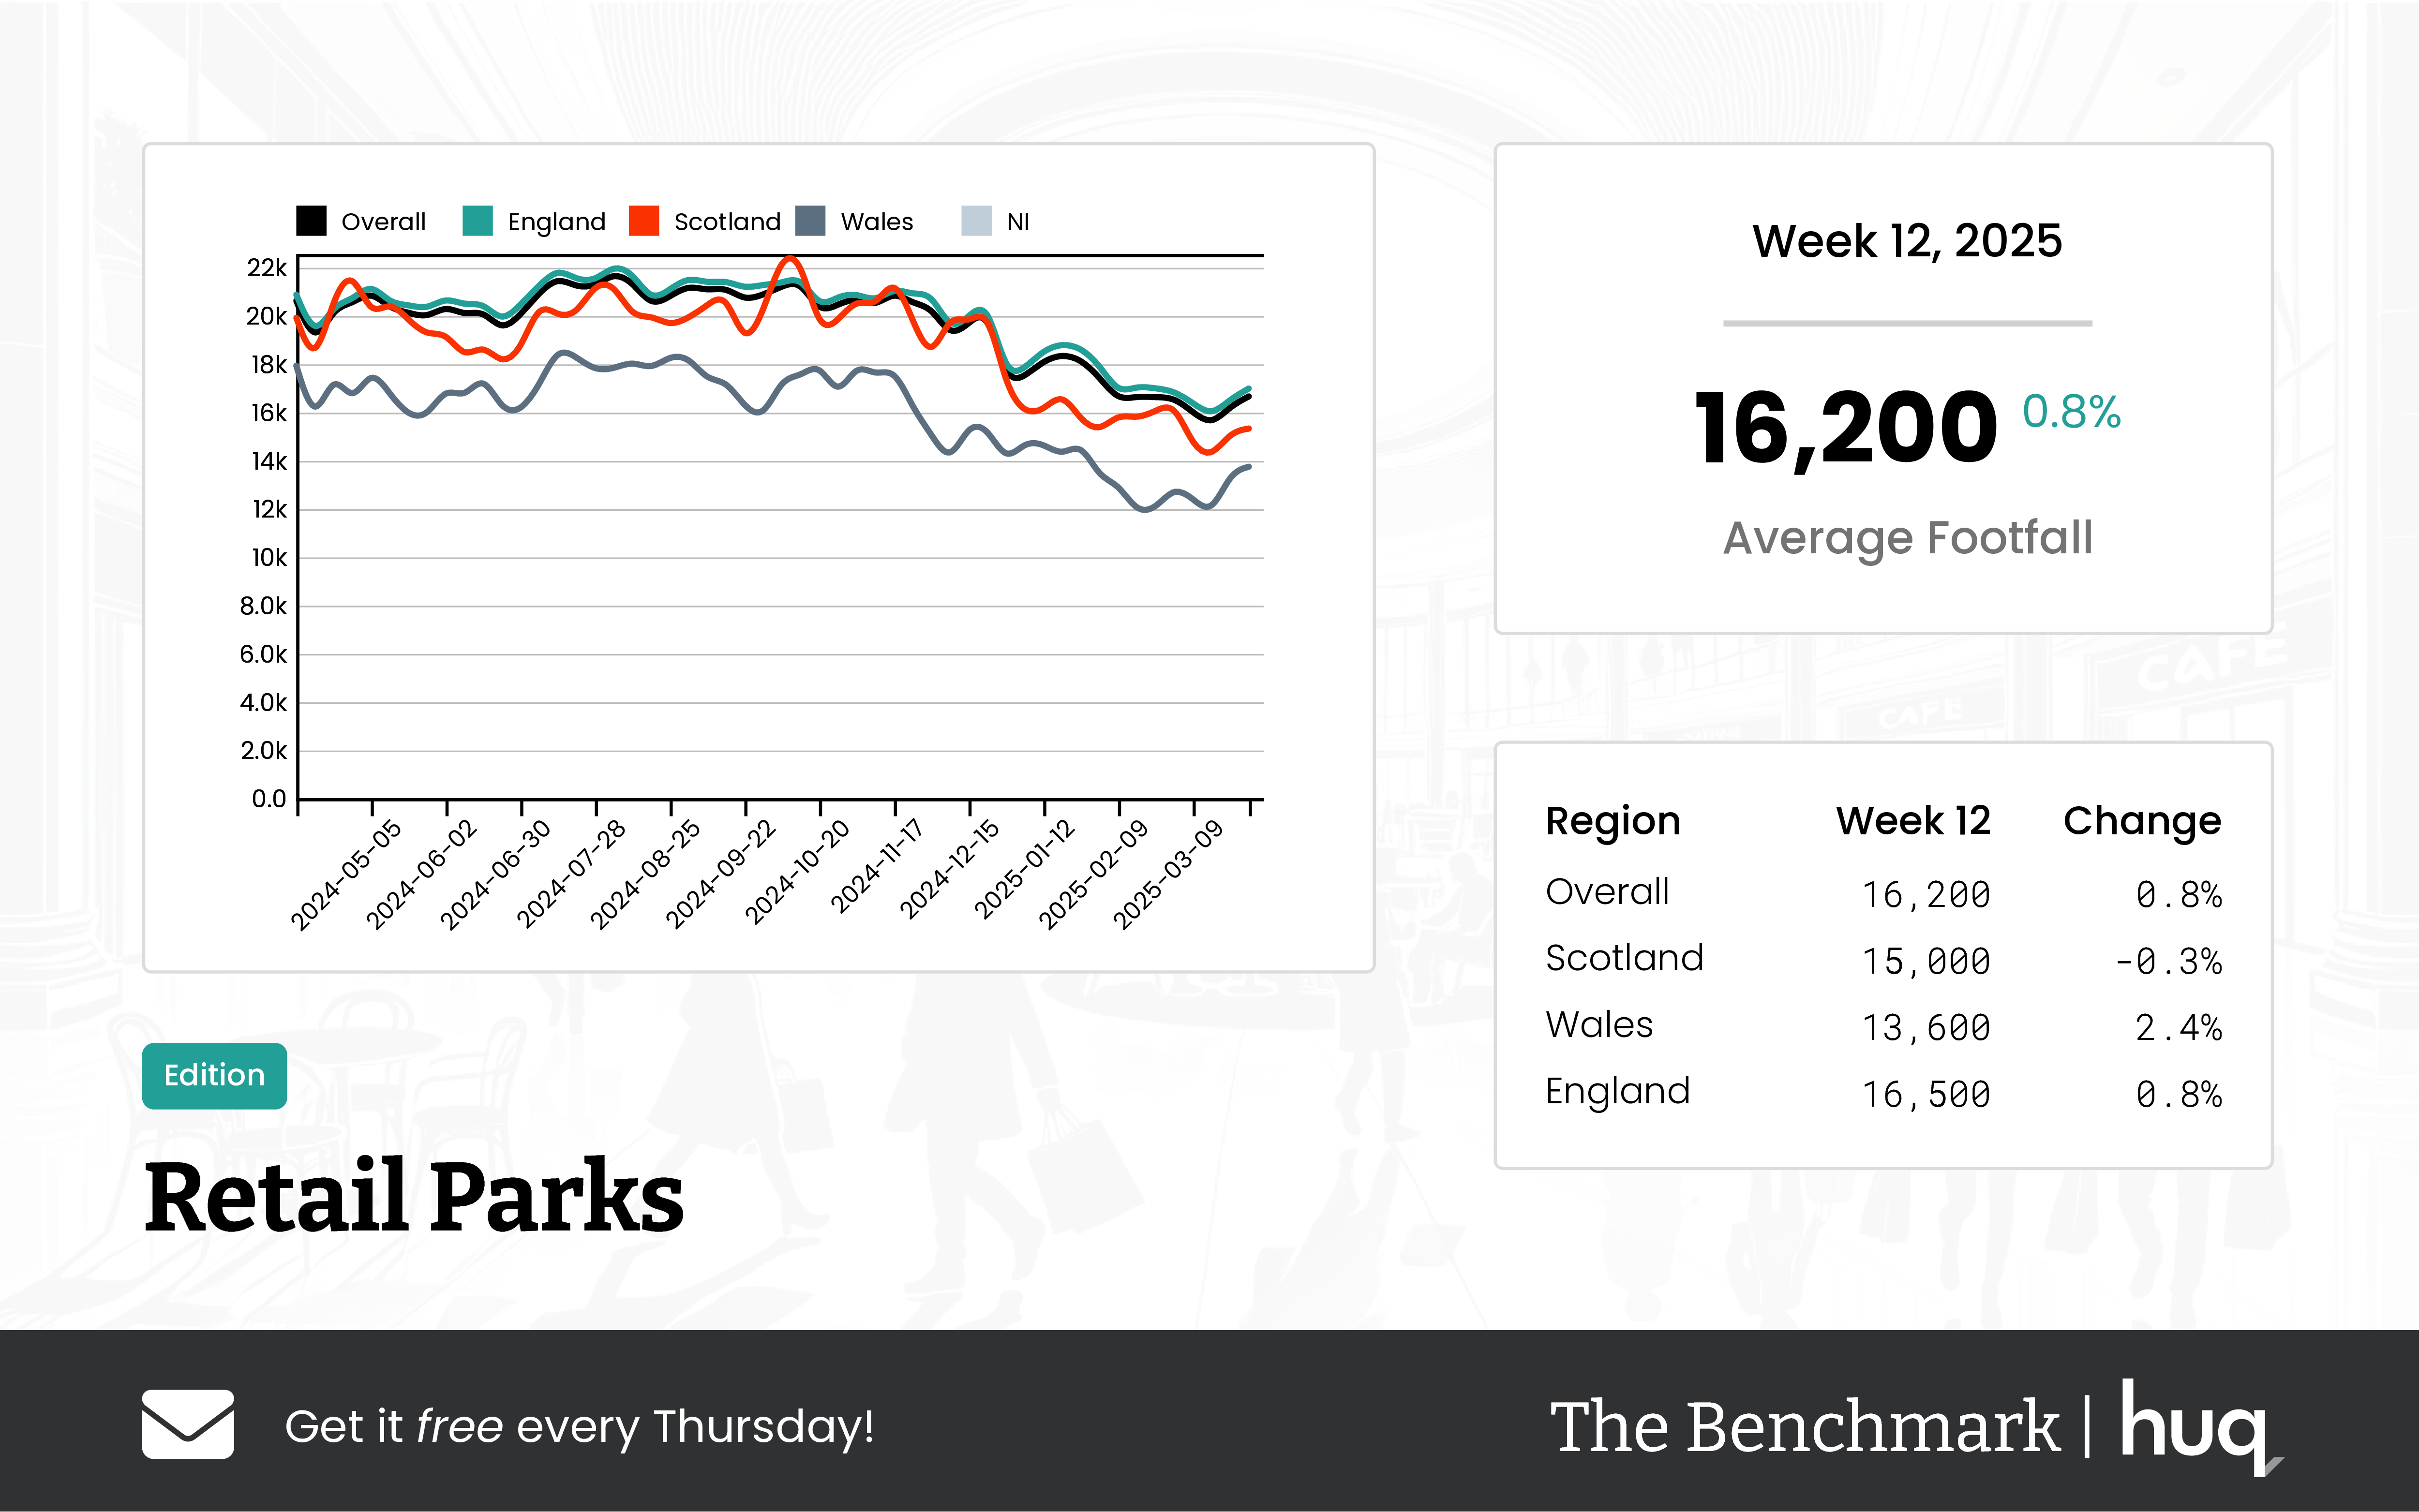
UK retail parks saw a modest week-on-week 0.8% boost in footfall, despite a 19.3% year-on-year decline. Recent trends from footfall analytics suggest evolving visitor habits.

April 3, 2025
2 min read
Table of contents
Overall Performance
The latest data from The Benchmark provides an insightful overview of footfall activity across UK retail parks. The average daily visitor count now stands at 16,200, reflecting a modest weekly improvement of 0.8%. However, when compared with the same week last year, the overall footfall figures show a 19.3% decline, underlining the ongoing challenges in returning to historic performance levels.
Regional Breakdown
In England, retail parks averaged 16,500 visitors daily, benefitting from a 0.8% gain over the past week, counterbalanced by an 18.7% drop year-on-year. Scotland, meanwhile, registered an average of 15,000 daily visitors, despite a slight weekly dip of 0.3% coupled with a marked annual decline. Wales presented a contrasting trend with retail parks attracting an average of 13,600 visitors per day, highlighted by a healthier weekly increase of 2.4%, though still facing a 19.1% decline compared to the previous year.
Visitor Behaviour
Additional analysis from footfall analytics reveals that the average dwell time per visit has reached 71 minutes. While this marks a 2.7% decrease from last week, it is nevertheless a 12.7% improvement over the previous year's figures—a signal of both enhanced visit quality and evolving spending potential. Delving deeper, regional variations are evident:
- In Scotland, visitors now spend an average of 81 minutes per visit, which is a result of a 3.8% increase week-on-week and a 15.7% annual rise.
- In England, dwell times remain consistent with the overall average, despite experiencing a slight weekly decrease of 1.4% and recording a 14.5% improvement year-on-year.
- Conversely, in Wales, shorter visits averaging 63 minutes suggest a softening in dwell time relative to earlier periods.
Industry Perspective
Joe Capocci, spokesperson for Huq Industries, commented on the evolving retail landscape: "The pronounced year-on-year decline in footfall, notably seen in Scotland, underscores the challenging environment currently facing retail parks. This is further highlighted by recent developments in the sector, like the opening of an IKEA mini retail park store."
These trends provide vital insights for stakeholders aiming to navigate the shifting dynamics of UK retail parks and adapt strategies for improved visitor engagement.
Media: For all media and press enquiries, please contact media@huq.io
About Huq Industries
Huq Industries is the leading provider of location intelligence across the UK, Europe, and the Middle East, specialising in delivering high-quality data insights on footfall, consumer behaviour, and retail performance. By leveraging advanced analytics, Huq Industries enables retailers and analysts to understand and respond to market trends effectively, ensuring they are well-equipped to navigate the changing landscape of high street and town centre commerce.
Get the latest intelligence Benchmark update each Thursday!
Frequently Asked Questions
Clear answers to the most common questions about movement intelligence, retail expansion, and location analytics.
Related Blogs and Insights



.svg)
Empowering strategic teams with the world's most accurate and accessible location intelligence.
Contact

.svg)