.svg)
UK Major Retail Centres – Week 32 2025: Footfall Retail Trends
UK Major Retail Centres recorded steady footfall trends in Week 32 2025 with an average daily footfall of 83,400, a 1.5% week-on-week decline and modest annual growth. Robust footfall data underpins balanced consumer sentiment.

August 21, 2025
2 min read
Table of contents
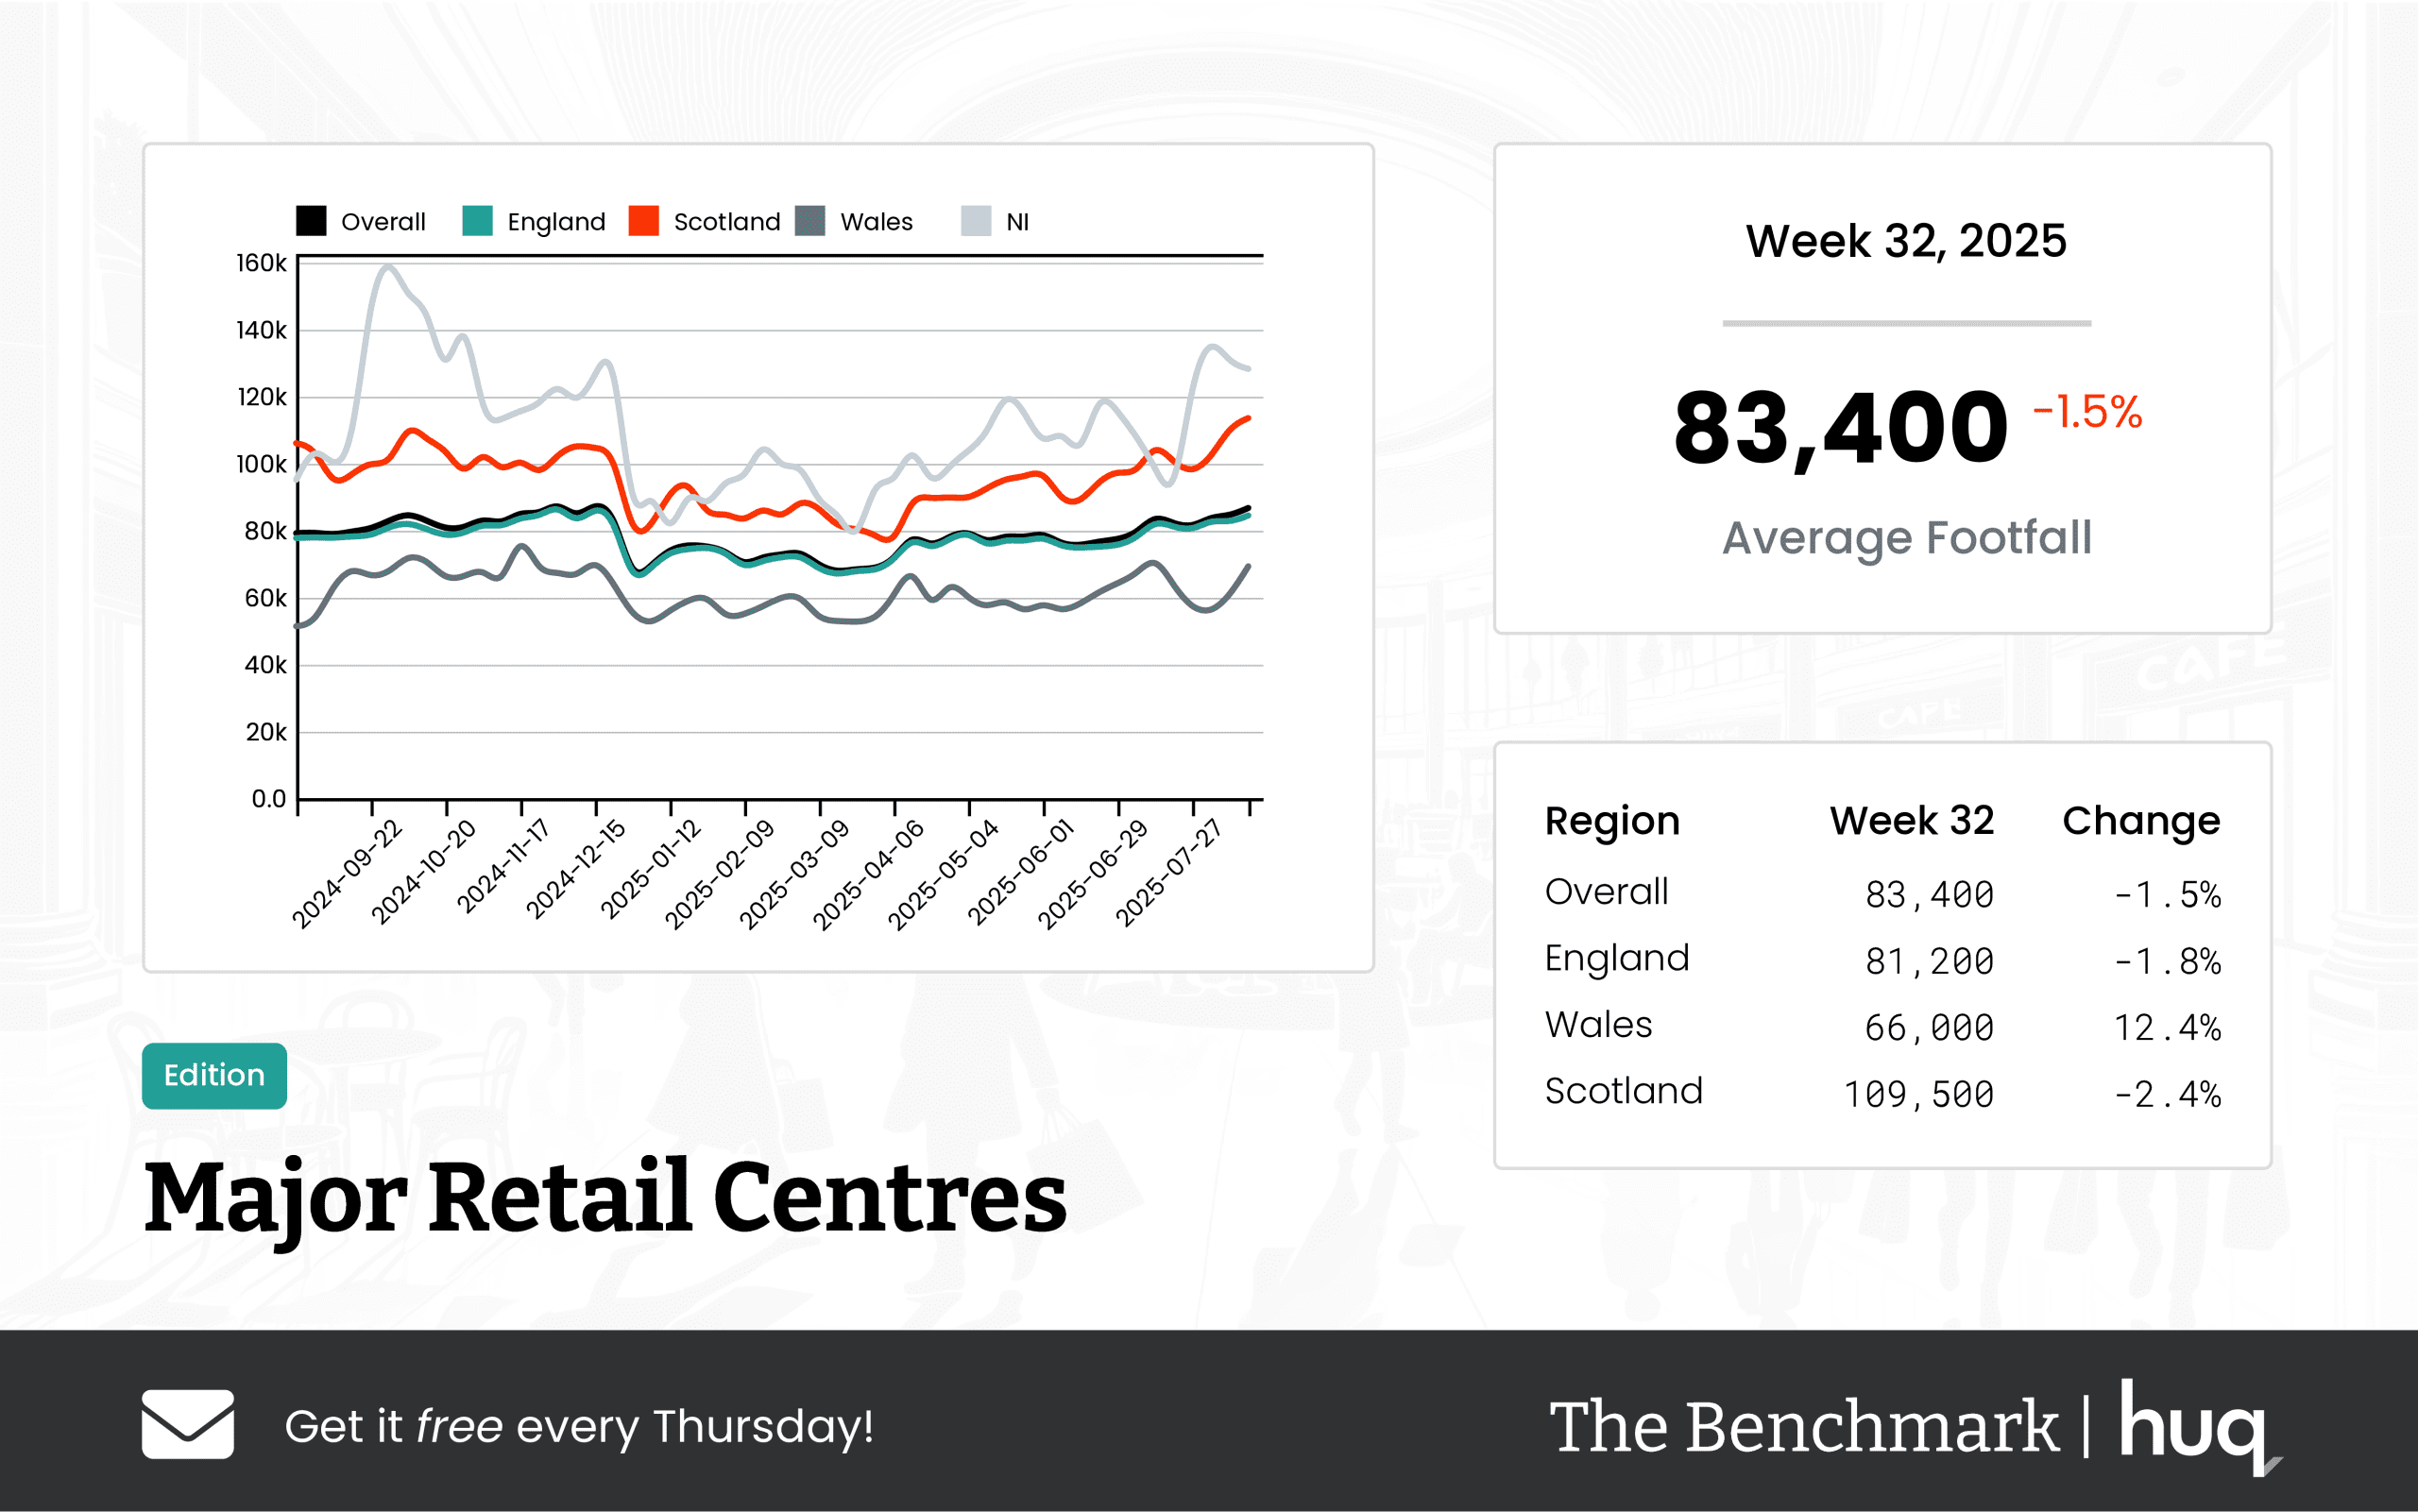
UK Major Retail Centres have displayed a balanced trend in Week 32 2025 with robust yet stable consumer activity noted throughout the week. The overall performance shows an average daily footfall of 83,400, marking a slight week-on-week decline of 1.5% while still recording a modest annual increase when compared to the same period last year. This performance reinforces a consistent market sentiment, even as some local variations come to light.
In terms of regional insights, there are significant differences across England, Scotland, and Wales. Retail centres in England averaged 81,200 daily visitors, experiencing a minor weekly drop of 1.8%, yet the year-on-year figures indicate a modest uplift of 4.4%. In Scotland, centres averaged a higher figure of 109,500 visitors per day; despite a small weekly softness of 2.4%, the annual numbers improved by a notable 7.5%, suggesting a steady recovery in the region. Wales, on the other hand, showed particularly strong performance with an average of 66,000 daily visitors and a robust week-on-week increase of 12.4%, accompanied by a sharp annual improvement. These regional variations are prominently supported by detailed footfall analytics and comparative studies.
The story does not end with just visitor numbers. An important aspect is the visitor dwell time, which has also recorded positive shifts. Across the retail centres, the average visit duration stood at 118 minutes—a slight week-on-week rise of 0.9% and an impressive 11.3% year-on-year increase. Specifically, visitors in England spent around 117 minutes with a weekly lift of 1.7%, while Scottish centres recorded a longer average stay of 131 minutes, showing steady weekly performance and strong annual improvement. Though Welsh centres recorded an average dwell time of 102 minutes, the overall trend remains positive with ongoing consumer engagement.
Industry experts are noting these changes with optimism. Joe Capocci, spokesperson for Huq Industries, commented on the evolving consumer habits, highlighting the surge in Welsh footfall alongside the steady engagement metrics. Capocci referenced current retail headlines, including significant events like the Biggest Bershka opening at Trafford Centre, which further emphasizes changing retail dynamics and consumer preferences. This industry commentary not only sheds light on the current metrics but also provides context for the evolving landscape of UK retail.
In conclusion, while Week 32 showed a slight week-on-week dip in overall numbers, the steady annual growth, regional strengths, and improving visitor engagement metrics suggest that UK Major Retail Centres continue to be resilient and adaptive in a changing retail environment.
Media: For all media and press enquiries, please contact media@huq.io
Frequently Asked Questions
Clear answers to the most common questions about movement intelligence, retail expansion, and location analytics.
Related Blogs and Insights



.svg)
Empowering strategic teams with the world's most accurate and accessible location intelligence.
Contact

.svg)