.svg)
UK Local Retail Centres – Week 34, 2025 Performance Update: location analytics Insights
Modest recovery: a 1.1% rise in dwell time versus a 5.8% overall decline. Strong location analytics and retail performance drive UK Local Retail Centres’ update.

September 4, 2025
2 min read
Table of contents
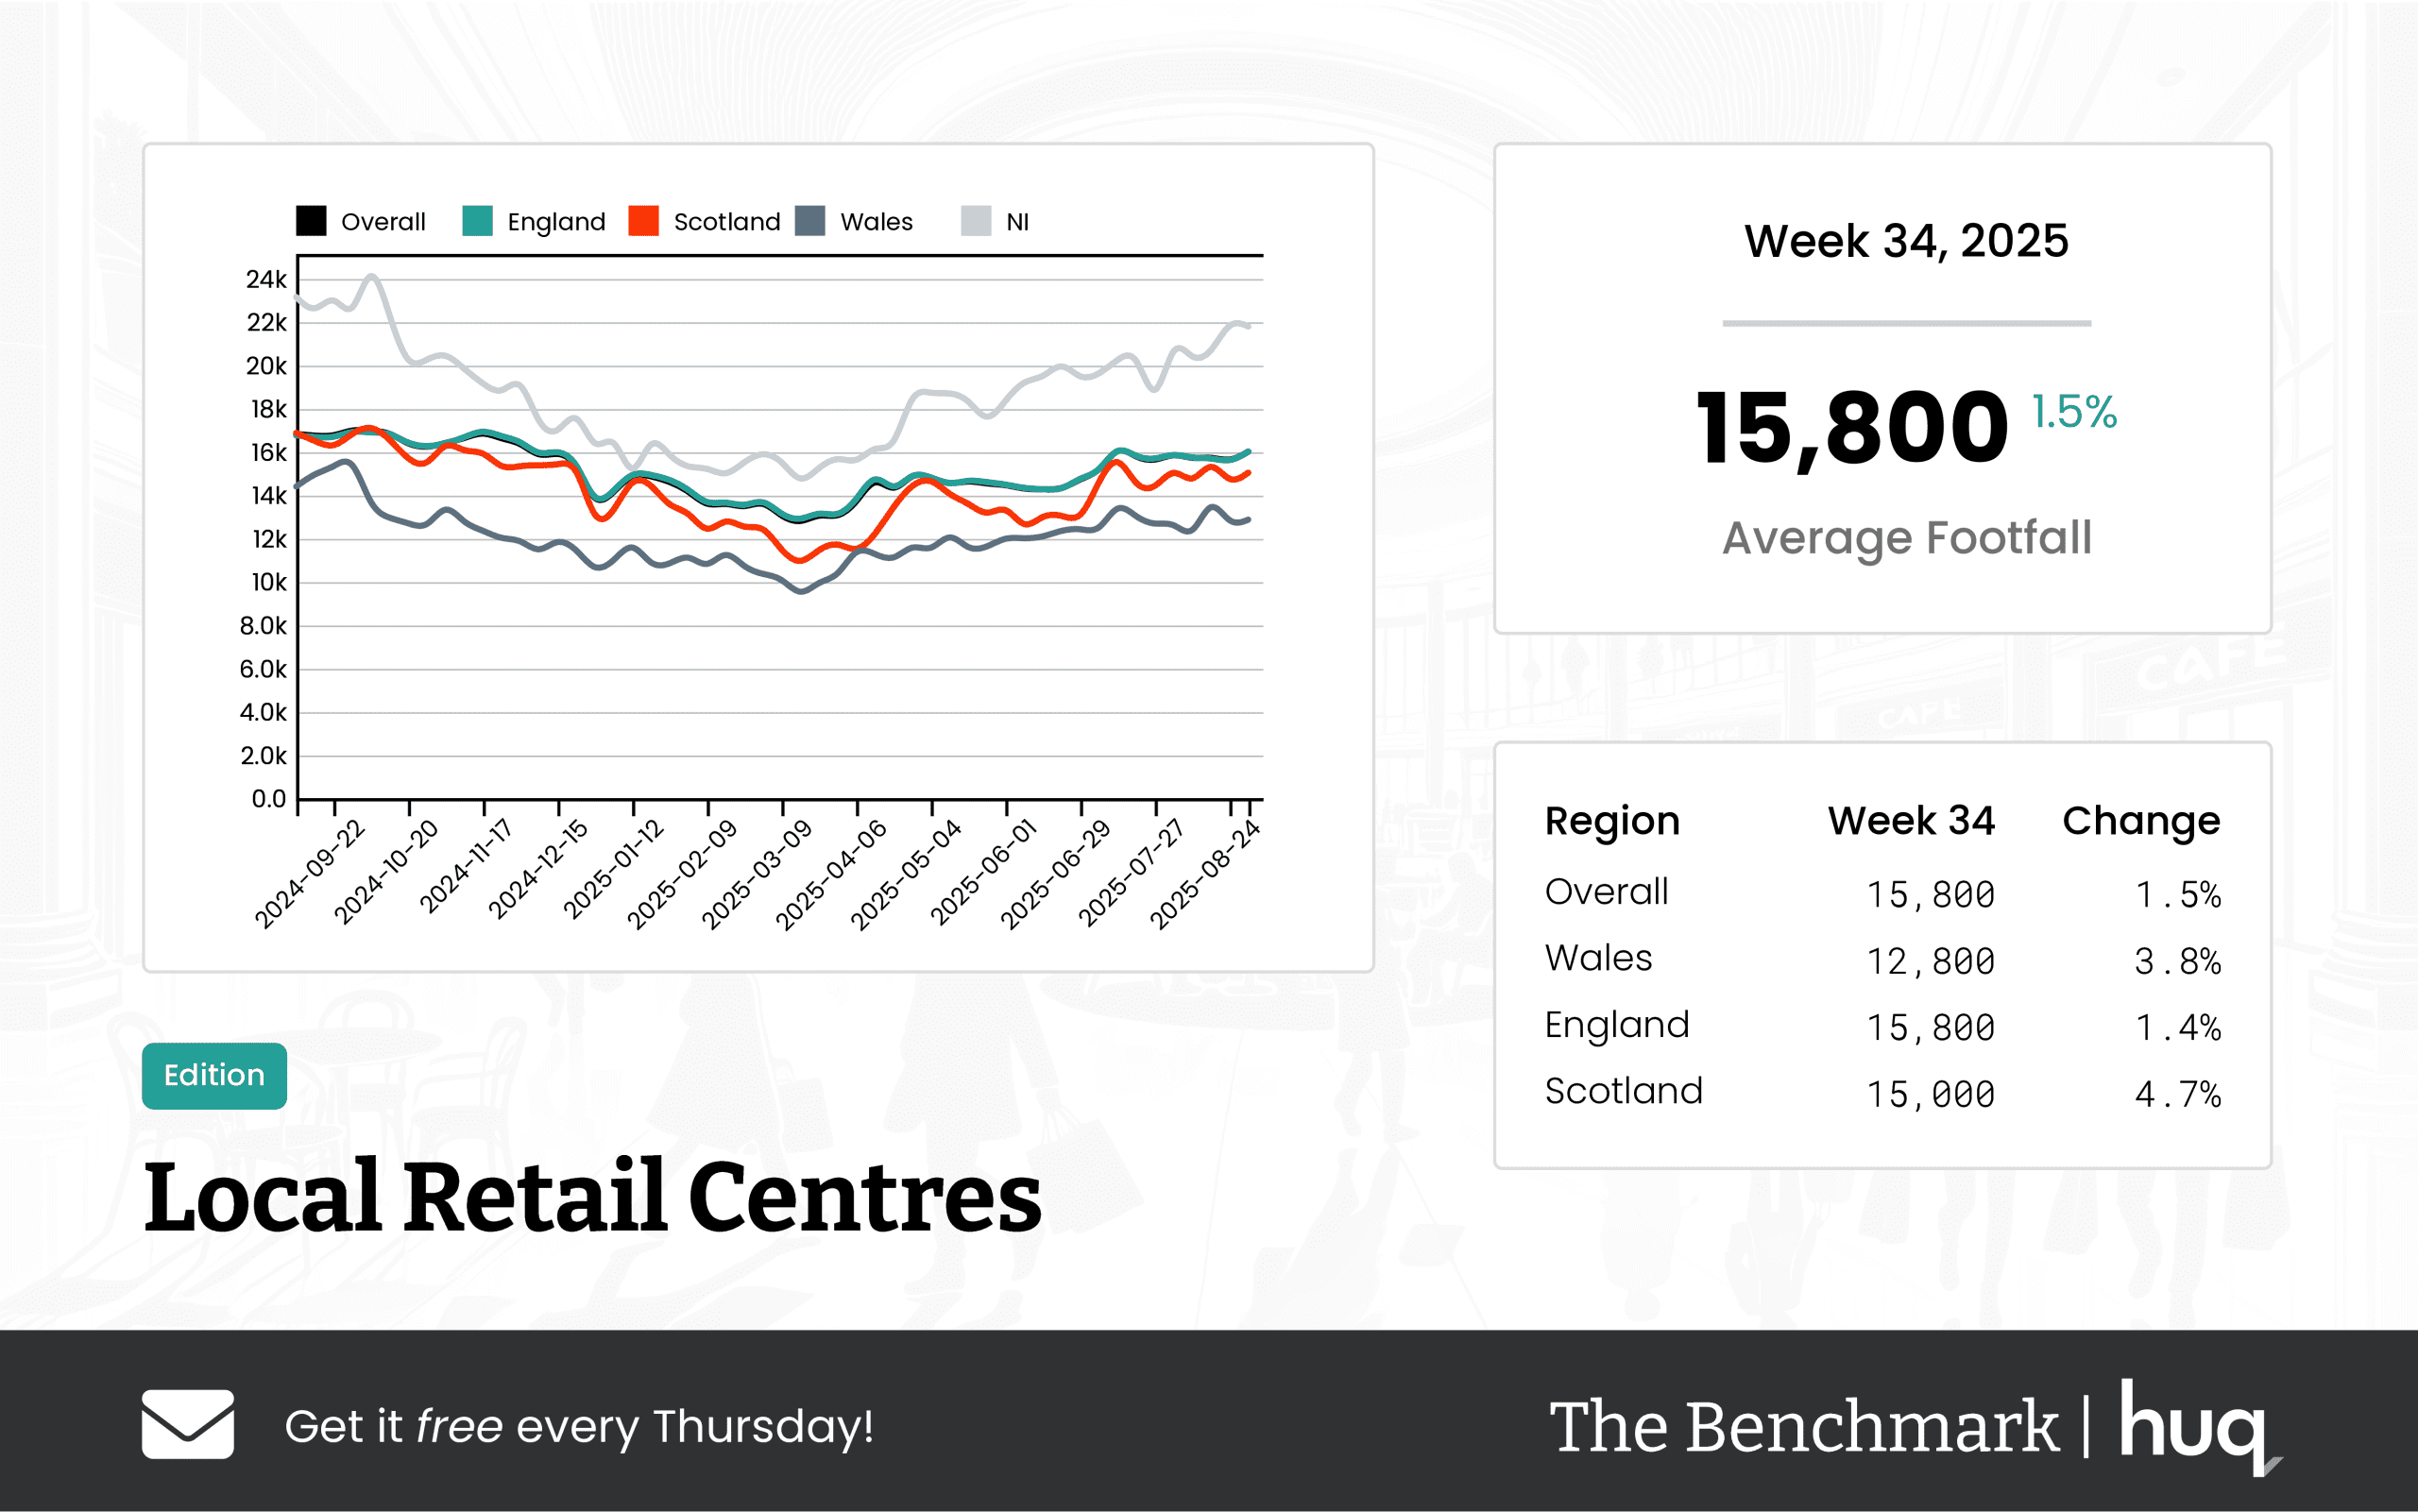
During the week ending 2025-08-31, UK Local Retail Centres recorded an overall average daily footfall of 15,800. Compared with the previous week, this represents a modest increase, while the year on year performance indicated a decline of approximately 5.8%. Dwell time across the UK also showed modest improvement, with an overall average visit length of 95 minutes, rising slightly by 1.1% on a weekly basis and improving by 4.4% compared with the previous year.
Across England, footfall performance remained consistent with an average daily figure of 15,800, accompanied by a week-on-week change of 1.4% and a year-on-year dip of 5.6%. In Scotland, the average daily footfall was slightly lower at 15,000, demonstrating a weekly boost of 4.7%, while the year-on-year figure declined by 9.4%.
Wales exhibited a different trend with an average daily footfall of 12,800. Although Wales experienced a weekly increase of 3.8%, the region faced a notable year-on-year decline of 14.7%. This decline contrasts with dwell time measurements, where visitors in Wales spent considerably longer, with an average visit duration of 146 minutes.
While overall dwell time saw slight improvements, regional variations are evident. Scotland reported lower average visit times of 84 minutes, showing only minor weekly improvements. The increased dwell time in Wales highlights a regional trend of customers spending more time during their visits, despite the lower overall footfall numbers.
Media: For all media and press enquiries, please contact media@huq.io
Frequently Asked Questions
Clear answers to the most common questions about movement intelligence, retail expansion, and location analytics.
Related Blogs and Insights



.svg)
Empowering strategic teams with the world's most accurate and accessible location intelligence.
Contact

.svg)