.svg)
UK Local Retail Centres – Week 18, 2025 Performance Update with Location Analytics
UK local retail centres saw a modest 1.5% decline overall, reflecting subtle shifts. Location analytics and location intelligence insights highlight smoothing trends.

May 15, 2025
3 min read
Table of contents
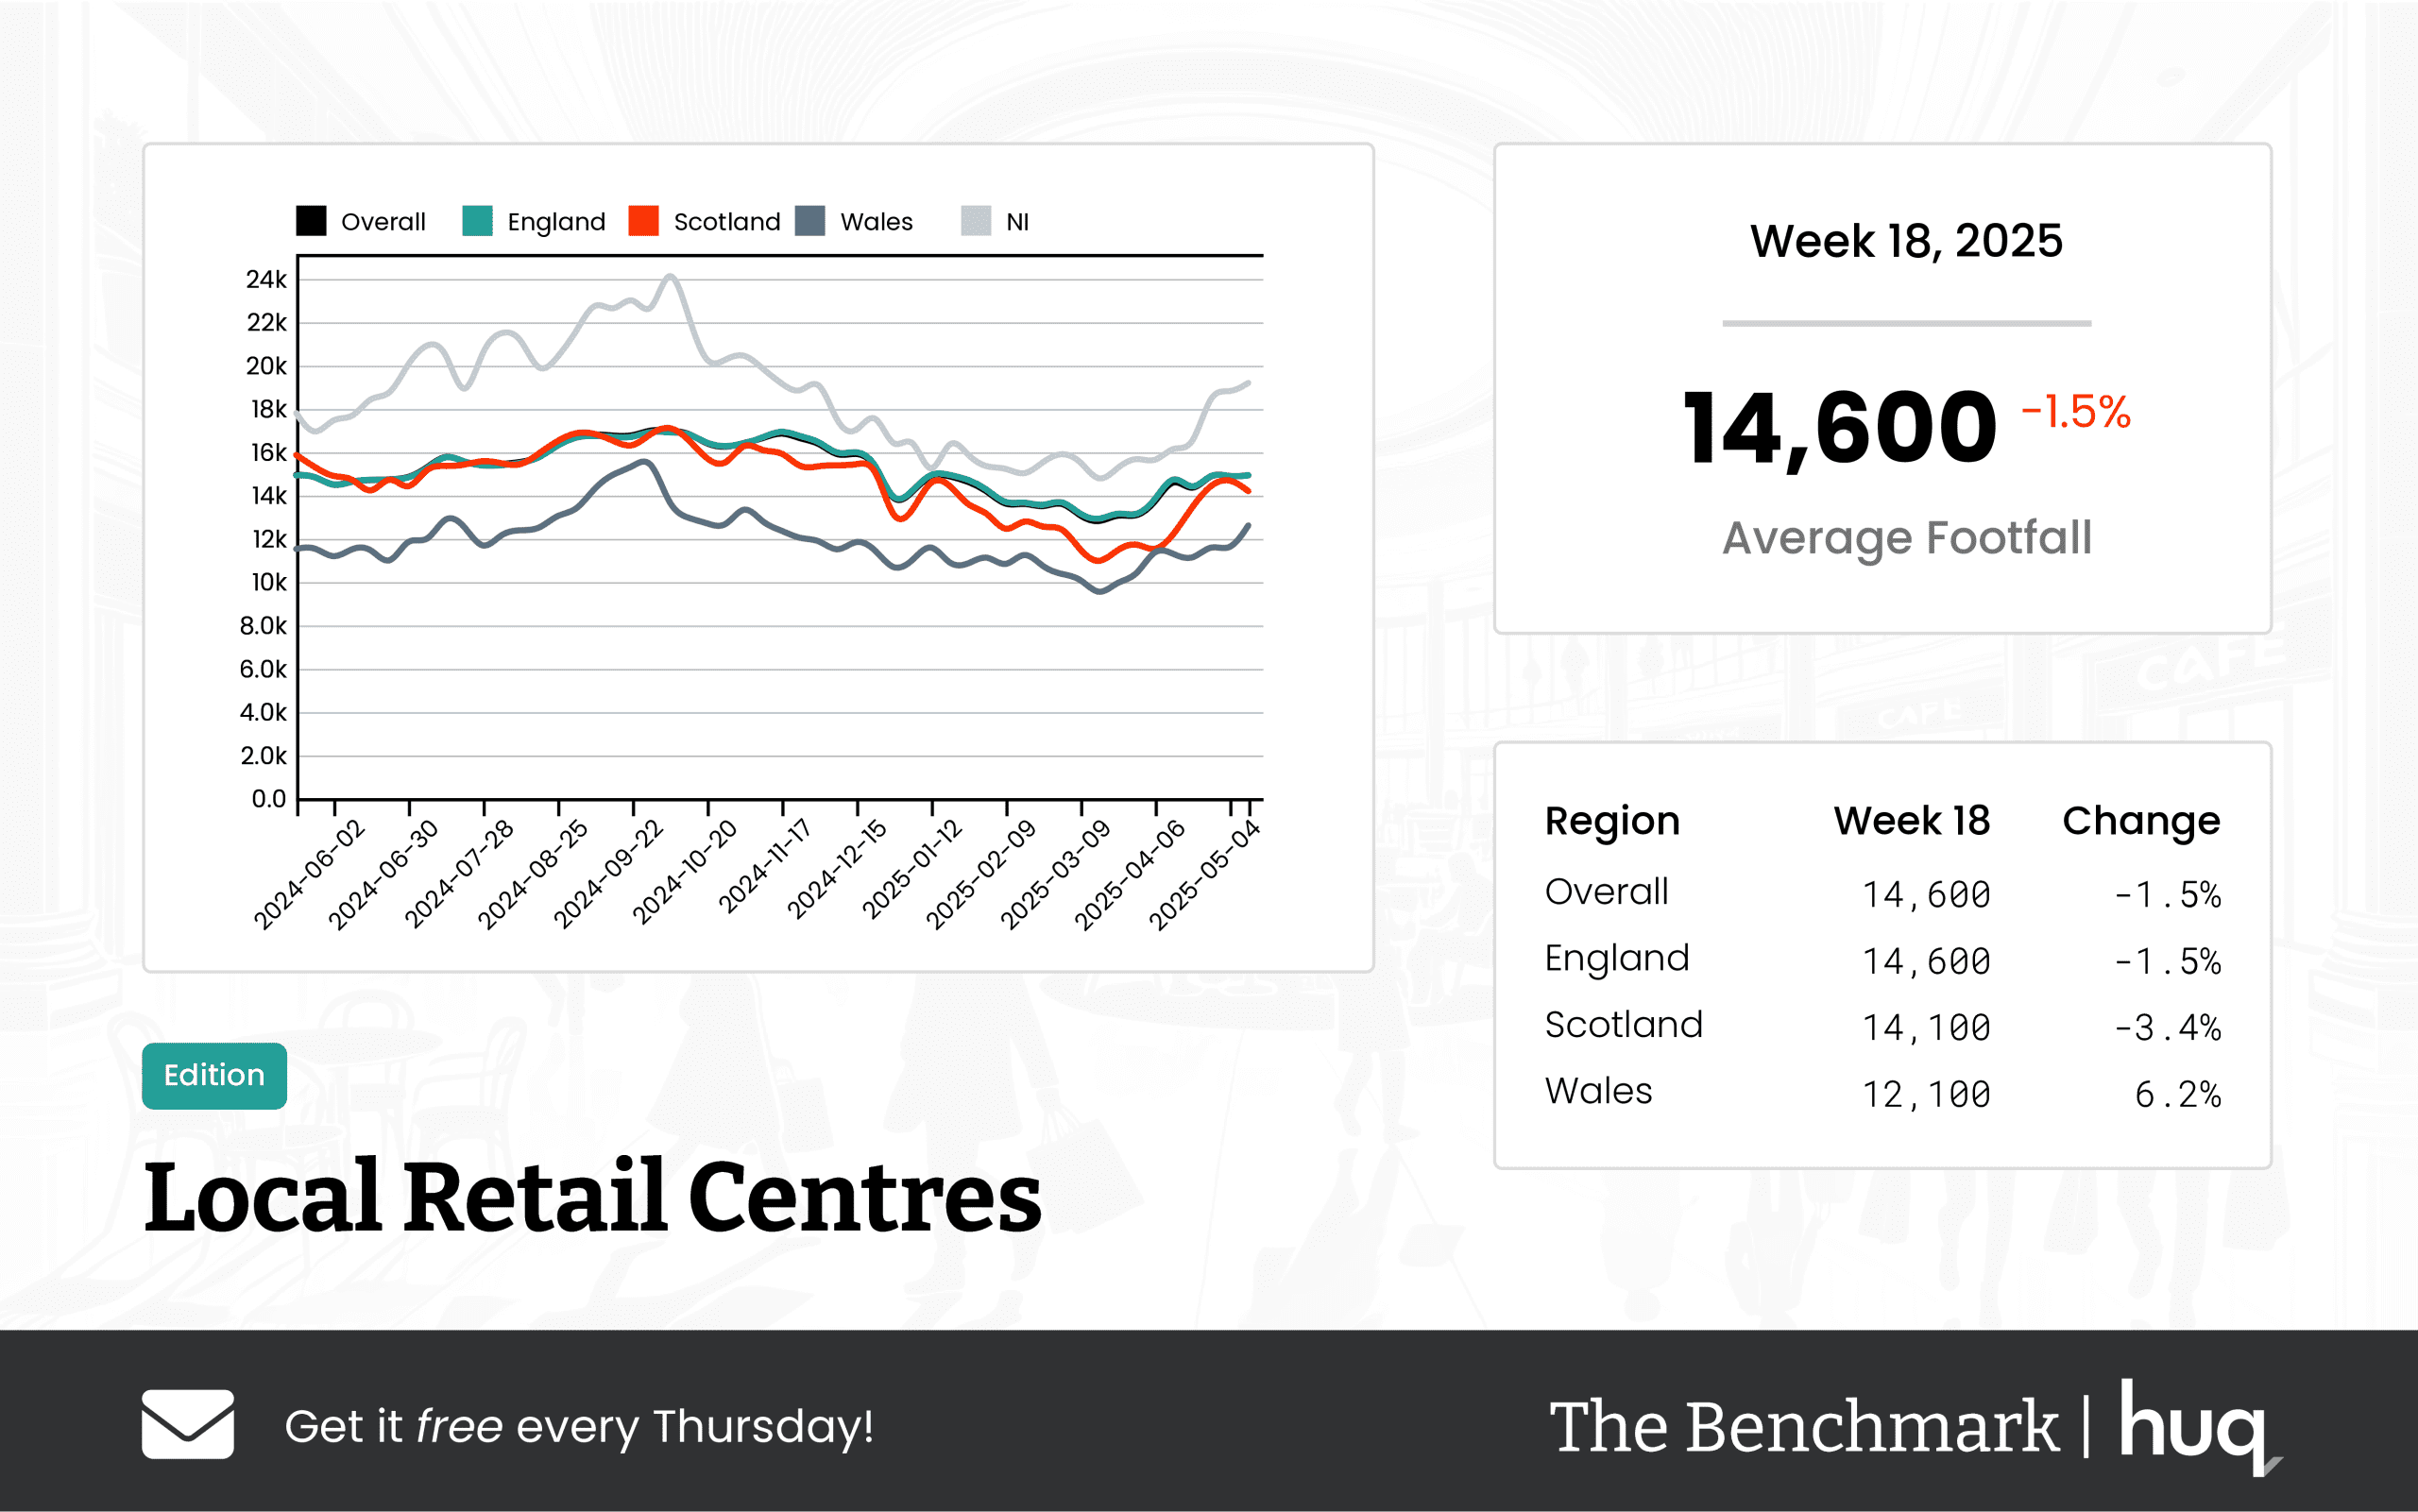
The latest figures for Week 18, 2025 provide a nuanced snapshot of footfall and engagement metrics across UK local retail centres, drawing heavily on advanced location analytics to better understand prevailing trends.
Overall Performance
Across the board, UK Local Retail Centres recorded an average daily footfall of 14,600, which represents a modest decline of 1.5% compared to the previous week. This figure is also 1.1% lower compared to the corresponding period last year, suggesting that while retail traffic remains relatively robust, emerging patterns are indicative of subtle shifts in consumer behavior. Location intelligence plays a critical role in deciphering this data, providing brands with the insights needed to adjust and strategize effectively.
Regional Overview
Diving into the regional statistics, distinct differences emerge:
• England: Centres in England have maintained an average of 14,600 daily visitors. Despite minor week-on-week declines, these figures are only slightly lower year over year, highlighting a stable performance.
• Scotland: The Scottish region experienced a sharper contraction, with local centres drawing an average of 14,100 daily visitors. This downtrend, when compared to the previous week and last year, signals potential challenges in the region's retail engagement.
• Wales: In a contrasting narrative, Welsh retail centres recorded an average of 12,100 daily visitors, showcasing a significant 6.2% increase from the previous week and a 2.7% improvement from a year ago. This upward swing is an encouraging sign and underscores the diversity in regional performance across the UK.
Engagement Metrics
In addition to footfall, engagement metrics, particularly dwell time, offer further insights. Nationwide, visitors spent an average of 99 minutes per visit in centre environments. This figure reflects a slight 1% improvement week-on-week and an impressive 17.9% increase compared to last year.
Additional details include:
• England: Visitors spent an average of 98 minutes per visit. Although there was a minor weekly decline, the overall year-on-year improvement marks a positive trend in customer engagement.
• Scotland: Centres in Scotland saw visitors committing longer stays, with an average visit lasting 120 minutes. This substantial increase suggests heightened consumer engagement where indoor experience improvements may be taking hold.
• Wales: Average dwell times in Wales were recorded at 94 minutes, with a strong week-on-week improvement, even as annual figures showed a modest softening.
Final Analysis
Location intelligence is emerging as a powerful tool in retail strategy. It not only provides granular insights into consumer movement and behavior but also equips retail brands with the foresight to adapt to regional variances effectively. As echoed by Joe Capocci, spokesperson for Huq Industries, while the overall modest decline contrasts with Wales' significant weekly improvement, the differing regional performances call for a strategic review of the existing operational and revitalization plans for local shopping centres.
By integrating location analytics into performance updates, retailers can expect to achieve a deeper understanding of market dynamics, keeping them ahead in a rapidly changing retail landscape.
Media: For all media and press enquiries, please contact media@huq.io
About Huq Industries
Huq Industries is the leading provider of location intelligence across the UK, Europe, and the Middle East, specialising in delivering high-quality data insights on footfall, consumer behaviour, and retail performance. By leveraging advanced analytics, Huq Industries enables retailers and analysts to understand and respond to market trends effectively, ensuring they are well-equipped to navigate the changing landscape of high street and town centre commerce.
Get the latest intelligence Benchmark update each Thursday!
Sign Up NowFrequently Asked Questions
Clear answers to the most common questions about movement intelligence, retail expansion, and location analytics.
Related Blogs and Insights



.svg)
Empowering strategic teams with the world's most accurate and accessible location intelligence.
Contact

.svg)