.svg)
UK High Streets & Town Centres – Week 39, 2025 Performance Update: Insights from Location Analytics
UK High Streets & Town Centres saw a 4.6% annual rise and a 0.7% week-on-week drop, highlighting resilience through strong location analytics and insightful location intelligence.

October 9, 2025
2 min read
Table of contents
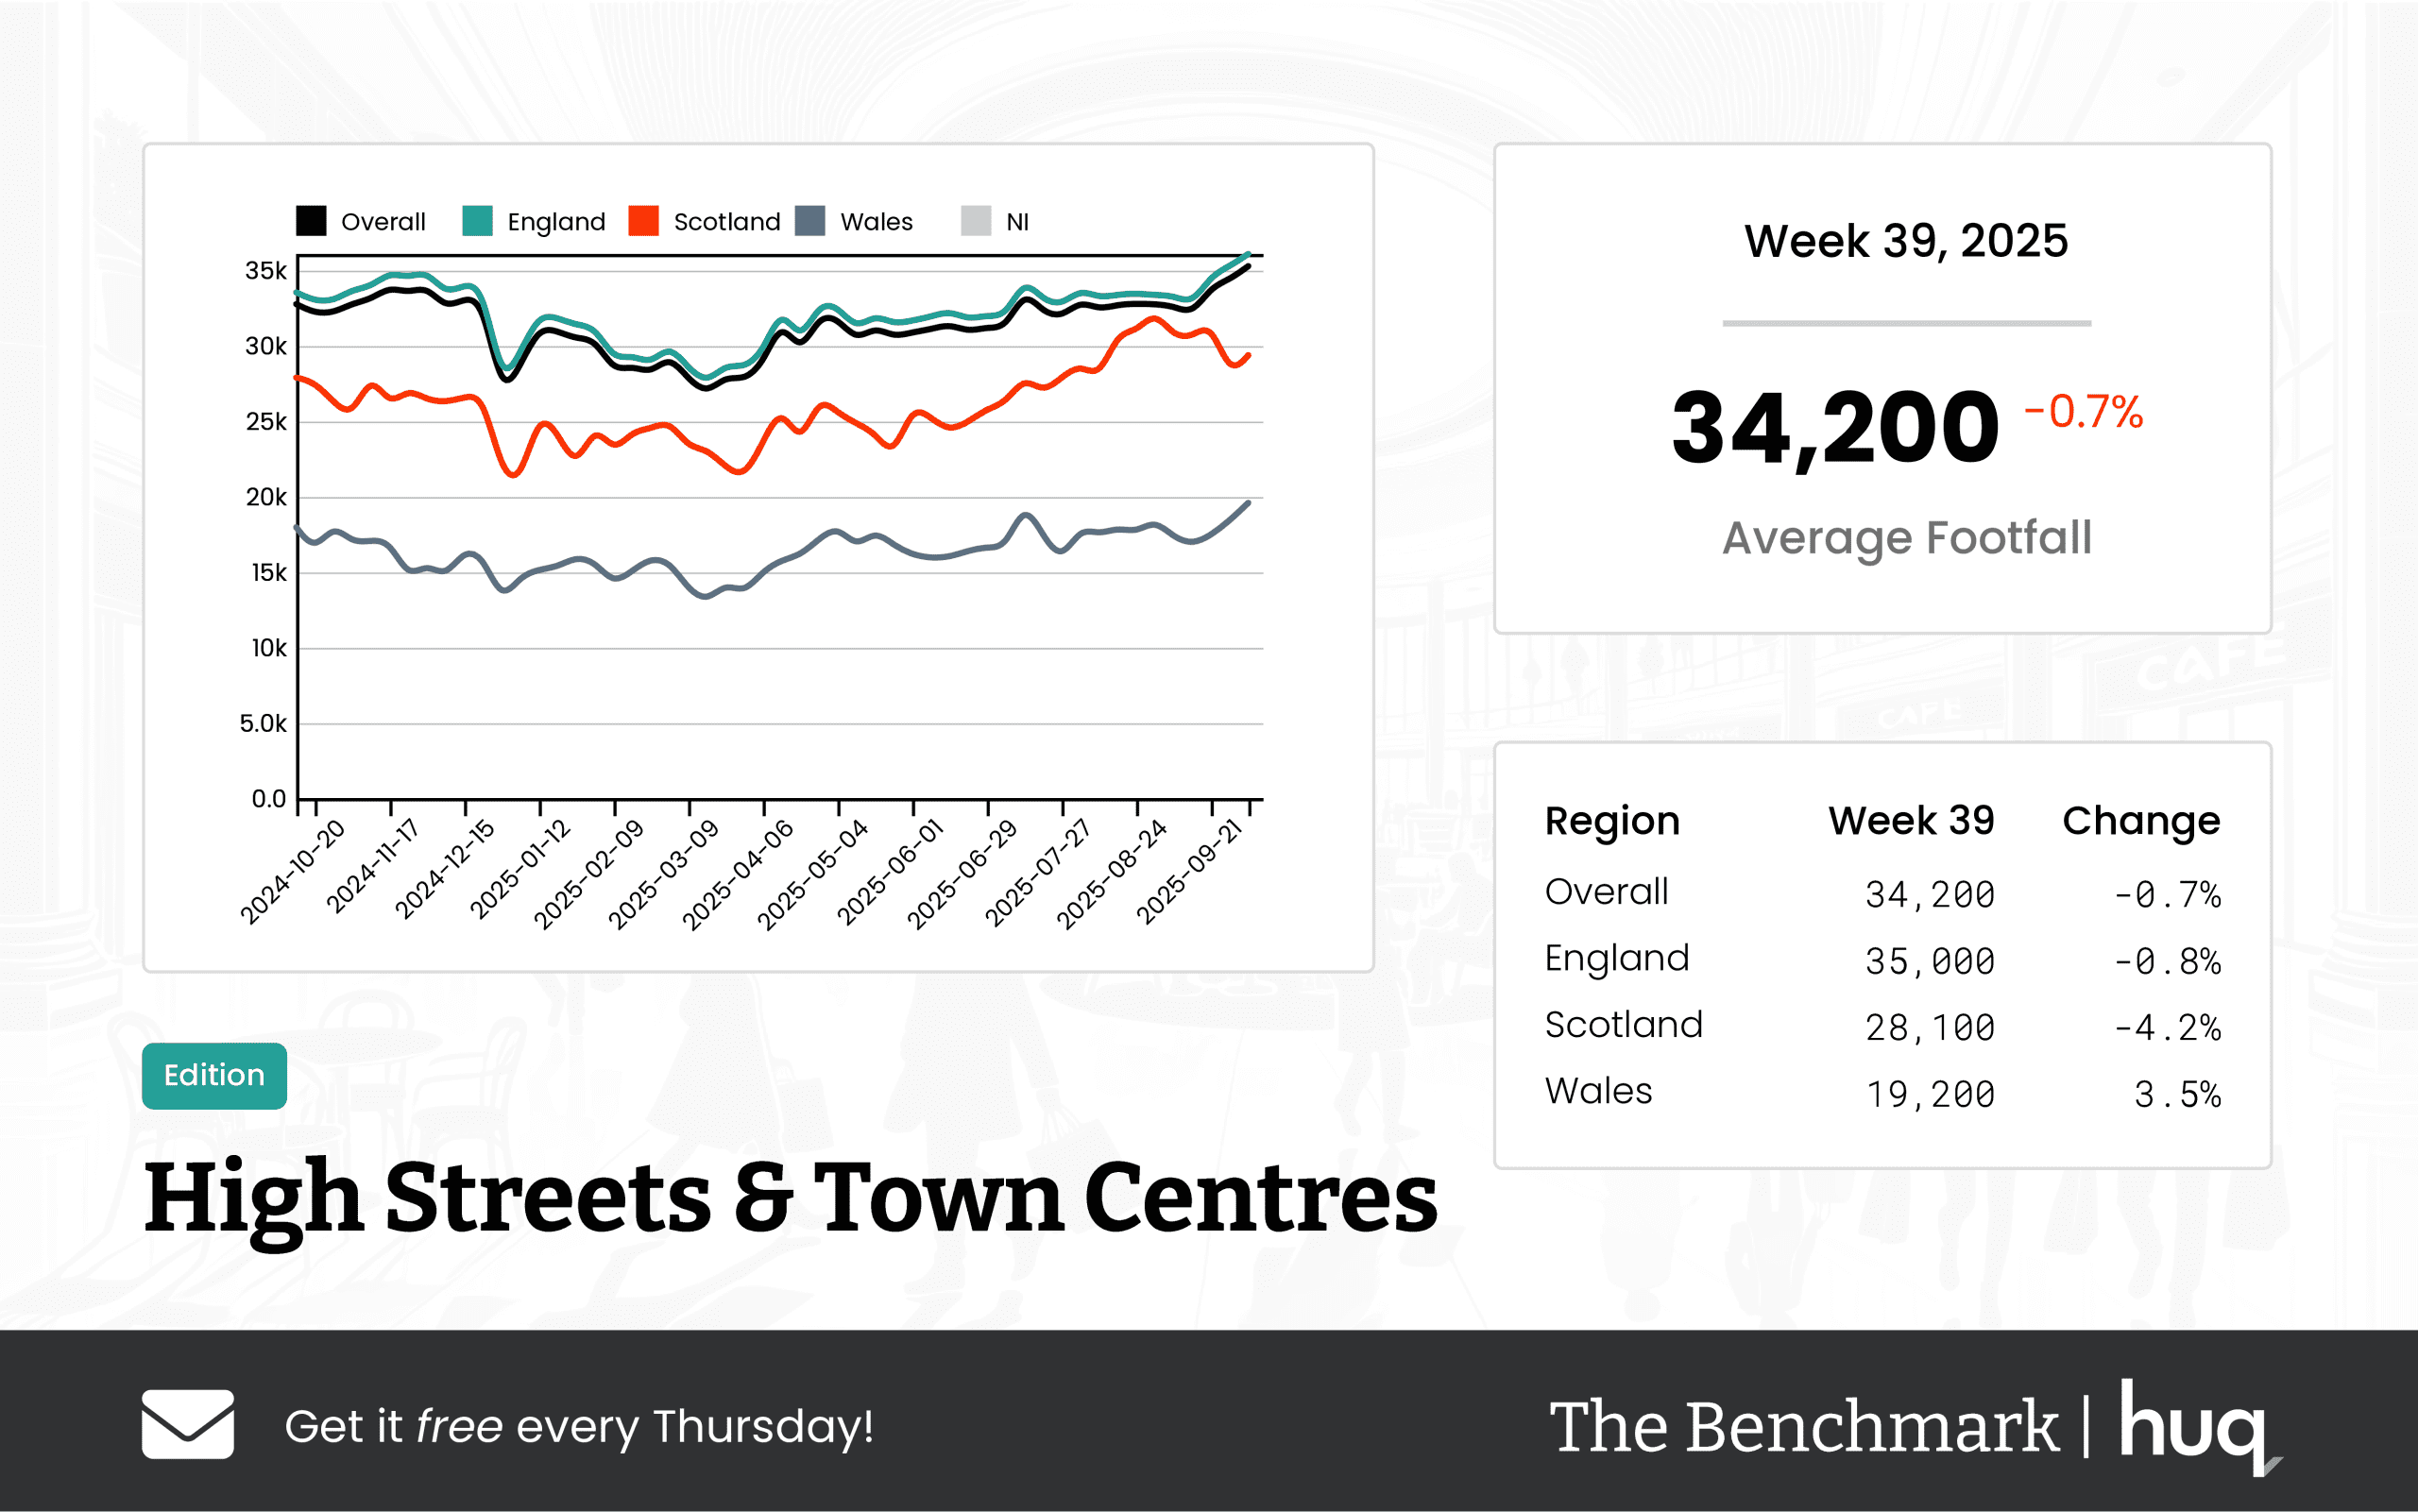
The latest Benchmark data for Week 39 reveals a complex yet optimistic picture for UK High Streets and Town Centres. Powered by advanced location analytics, the overall average daily footfall stands at 34,200 – a slight 0.7% decline from the previous week yet buoyed by a 4.6% increase compared to the same period last year. This nuanced performance signals that, while short-term challenges remain, the retail landscape is generally robust and resilient.
Breaking down the figures by region offers further clarity. In England, High Streets recorded an average of 35,000 visitors each day. Despite a small weekly dip of 0.8%, there is comforting annual growth of 4.4%, affirming the steady pace of recovery and consumer confidence. Scotland, on the other hand, experienced a more notable 4.2% week-on-week drop with 28,100 daily visitors, though the year-on-year gain of 2.4% suggests some underlying positive trends. Wales emerges as a standout region – footfall not only increased by 3.5% on a weekly basis, but the annual growth reached an impressive 9.7%, backed by emerging insights from location intelligence.
Visitor dwell time is another important metric complementing footfall data. Overall, visitors are spending an average of 108 minutes per visit – a modest week-on-week boost of 0.9% and an annual lift of 18.7%, indicative of deeper customer engagement and satisfaction. Regionally, England's dwell time remains consistent at 108 minutes. Scotland shows a slightly lower average of 104 minutes, though recent weeks have witnessed an encouraging spike likely driven by an improved in-store experience influenced by location intelligence data. Conversely, Wales sees a drop to 102 minutes, suggesting shorter but more frequent visits as footfall continues to rise.
Industry commentary from Joe Capocci, Spokesperson for Huq Industries, underscores the significance of these findings. "Wales’ footfall sharp increase and its positive weekly momentum, as echoed in recent industry headlines, underline the nuanced changes across regions," Capocci stated. This insight epitomizes how detailed, data-driven location intelligence is providing the clarity needed to navigate challenging market dynamics.
In summary, while Week 39 reflects a slight short-term contraction in footfall, the broader annual trends and deeper insights into dwell time demonstrate that UK High Streets and Town Centres are adapting well through informed, location-based strategies. Retailers and regional planners alike are encouraged by the resilience highlighted through these robust analytics, anticipating that continued adjustments will drive further recovery and growth in the months to come.
Media: For all media and press enquiries, please contact media@huq.io
Get the latest intelligence Benchmark update each Thursday!
Frequently Asked Questions
Clear answers to the most common questions about movement intelligence, retail expansion, and location analytics.
Related Blogs and Insights



.svg)
Empowering strategic teams with the world's most accurate and accessible location intelligence.
Contact

.svg)