
Cross-shopping analysis
·
United States
Cross-shopping data: see where else your visitors go
Compare up to 10 location pairs at once and see the share of visitors each pair has in common. Get a free cross-visitation analysis.
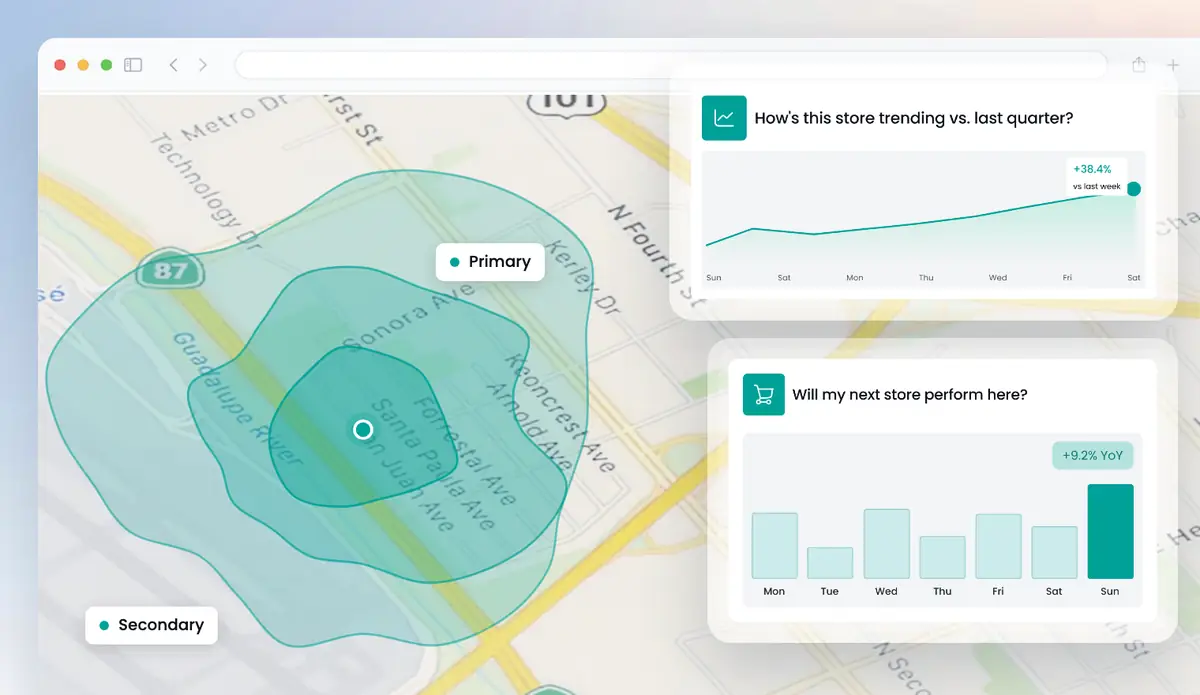
Get a free analysis of your locations
Up to 5 locations. No cost, no commitment.
We handle your details in line with the CCPA and applicable US state privacy laws.
Cross-shopping is when the same people visit more than one store, brand or center. Huq measures it through visits: the share of one location's visitors who also visit another. Its cross-visitation tool compares up to 10 location pairs at once, across your stores and competitors', and rival brand locations are quick to add. Huq manually validates more than 1,000 locations in each of its 35 markets twice a year. Start with a free analysis of the locations you choose.
See how cross-shopping analysis works in Huq
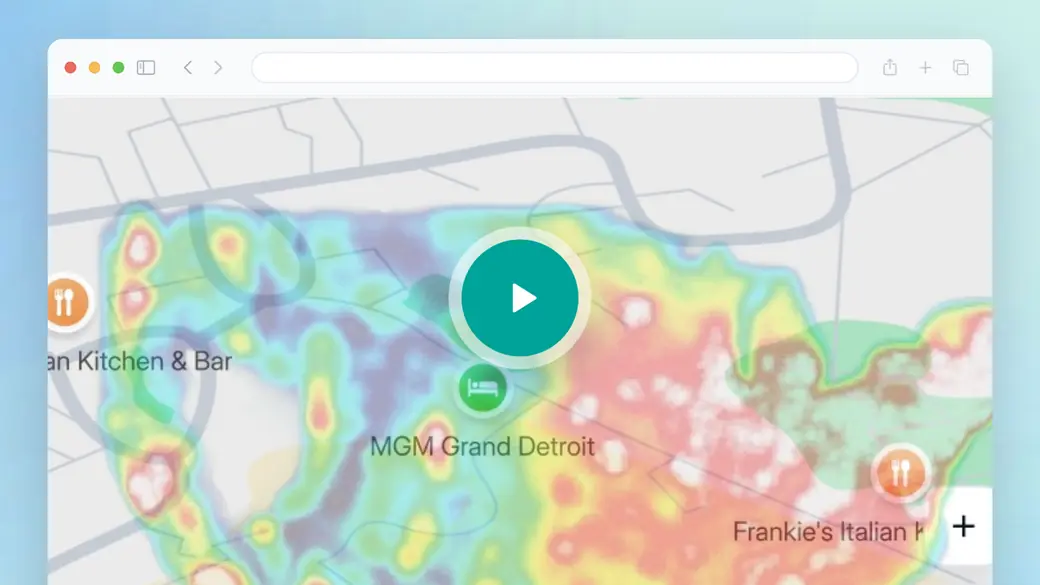
The overview tours the Huq platform: the Explore map, the metrics returned for each area and Projects for monitoring many locations. For cross-shopping, look at how stores, centers and brand locations are added as areas, because those areas become the pairs in a cross-visitation analysis. Results export to CSV or Excel, or arrive as Parquet and CSV data feeds in your Amazon S3 or Google Cloud Storage bucket.
- Cross-visitation: shared and unique visitors for up to 10 location pairs, laid out in one results matrix.
- Brand locations layer: add a rival brand's stores to the analysis without building the list yourself.
- Catchment and drive time: show whether two locations draw on the same neighborhoods, not just the same people.
Trusted by 300+ organisations · Data across 35 markets






What is cross-shopping?
Cross-shopping describes customers who split their visits between more than one store, brand or location. In the physical-store sense, it answers a simple question: of the people who visit location A, what share also visit location B?
The term is also used for comparison shopping online and for moving between website and store. This page is about physical visits. Cross-visitation data measures them by counting shared and unique visitors for each pair of locations. The overlap is often uneven. Many of a small store's visitors may also visit a large neighbor, while few of the neighbor's visitors return the favor.
Retailers use cross-shopping data to benchmark against competitors and avoid duplicating coverage. Landlords use it to plan co-tenancy and tenant mix. In Huq, brand analysis and industry performance sit alongside the results, so you can tell whether a shift comes from one rival or the whole category.
What's in your cross-shopping analysis
01
Cross-visitation results matrix
Shared and unique visitors for up to 10 location pairs at once, laid out in a single results matrix.
02
12-month overlap trend
How shared visitors between each pair change over the past 12 months, with a year-over-year comparison.
03
Catchment and visitor origin
Where each location's visitors come from, and how much the catchments of two locations overlap.
04
Brand and industry context
Brand analysis and industry performance show whether a change in overlap comes from one rival or the whole category.
What a cross-shopping analysis shows
Your free analysis covers a set of locations you choose, from your own network, competitors or neighboring brands.
01
Cross-visitation results matrix
Each cell shows the share of visitors two locations have in common. Read across a row to see where one location's visitors also go.
02
Shared vs unique visitors by pair
For each pair, see how many visitors are shared and how many are unique to each side. Uneven pairs show which location depends on the other.
03
Overlap trend over 12 months
Track how the overlap between each pair changes through the year, and compare it with the same period last year.
Cross-visitation data across the US
Huq covers any address in the United States: shopping centers, main streets, downtowns, strip malls, competitors' stores and sites you haven't opened yet. No counters, sensors or cameras needed.
Huq manually validates more than 1,000 locations in each of its 35 markets twice a year, and data refreshes weekly.
How it works
Step 1
Tell us your locations
Add up to five addresses in the form. Your own stores, candidate sites or competitors.
Step 2
We run the analysis
Our team maps each location from observed visitor data.
Step 3
We walk you through it
A short call to take you through what the data shows and what it means for you.
Why teams use Huq for cross-shopping data
- Huq publishes its accuracy by country: a 19.5% median error across published markets, against a 30% healthy threshold.
- Huq's customers give it an NPS of 42.
- Trusted by 300+ organizations across 35 markets, including the global insights, research and location intelligence teams at Nike, Adidas, JD Sports and Samsung.
huq's platform gave us valuable data to support a key decision on potential new sites.
Dan Brogden
National Sales Manager, Puccinos
Who it's for
01
Retail chains of any size
From five-store retailers planning their next site to national brands: choose locations, track store performance and benchmark against competitors.
02
Retail real estate owners
Show shopping center performance, support leasing and get the tenant mix right, for landlords, asset managers and brokers.
03
Investors and private equity
Check how retail brands and assets actually perform before you buy, and monitor them after.
Everything Huq measures, in one platform
- Foot traffic: by week, month and year, with totals, average daily foot traffic, trends, period-over-period change, and visiting vs passing traffic.
- Residents and visitors.
- Trade area and travel time: trade areas by ZIP code, plus drive-time and travel-time analysis.
- Demographics and profiling: age, gender and purchasing power, available in selected markets.
- Behavior: visit frequency, dwell time, time of day and dayparts, cross-visitation between up to 10 location pairs, and international visitation for tourism.
- Foot traffic density and transportation mode.
- Places, brands and industries: points of interest, brand locations and brand analysis, industry performance, shopping center and retail center types.
- Geo-spend: spend by volume and category, available in selected markets.
- Tools: the Explore map (draw any area or use layers for travel time, trade areas, shopping centers, retail centers, brand locations, industries and ZIP codes), White Space Analysis, and Projects for monitoring many locations and reporting to stakeholders.
- Delivery: the platform, CSV or Excel exports, monthly PDF location reports, and data feeds as Parquet and CSV files into Amazon S3 or Google Cloud Storage buckets.
- Cadence: data refreshes weekly.
Frequently asked questions
What is cross shopping?
Cross shopping is when the same customers split their visits between more than one store, brand or location. Huq measures it with visit data: for each pair of locations it shows shared and unique visitors, so you can see which places draw the same people and which draw different ones.
How do you measure cross-shopping between stores?
Define the locations, then count the visitors seen at both and at only one. Express shared visitors as a share of each location's total, because the overlap is often different in each direction. Huq does this for up to 10 location pairs at once.
Which other stores do my customers visit?
Add your store and the competitors, anchors or neighboring brands you want to test to one cross-visitation analysis. The results matrix shows what share of your visitors also visit each of them, and how that has changed over the past 12 months.
What's in the free cross-shopping analysis?
We run a cross-visitation analysis on locations you choose, including your stores and competitors' stores. You get the results matrix, shared and unique visitors for each pair and the overlap trend, and we walk you through it. There's no cost and no commitment.
How often is cross-visitation data updated?
Huq data updates weekly. Cross-visitation results include a 12-month trend, so you can see whether the overlap between two locations is growing or shrinking and compare it with the same period last year.
Can Huq measure cross-shopping at competitors' stores?
Yes. Huq measures visits at any address across the US, including competitors' stores, with no sensors, cameras or site access. That lets you test overlap between your locations and rivals on the same basis. Huq works in 35 markets and manually validates more than 1,000 locations in each market twice a year.
Questions? Talk to us
Book a demoAbout Huq
Huq is a location intelligence company. We turn anonymised mobile location data into footfall, catchment and visitor insight for any place, so retailers, property owners and local authorities can make decisions on evidence.
See how your locations really perform
Up to 5 locations. No cost, no commitment.