
Location intelligence software
·
Location intelligence software for Nordic retail and property
Footfall and visitor behaviour for any address in Huq's Nordic markets. One platform, weekly data, 800+ validated target areas across Europe.
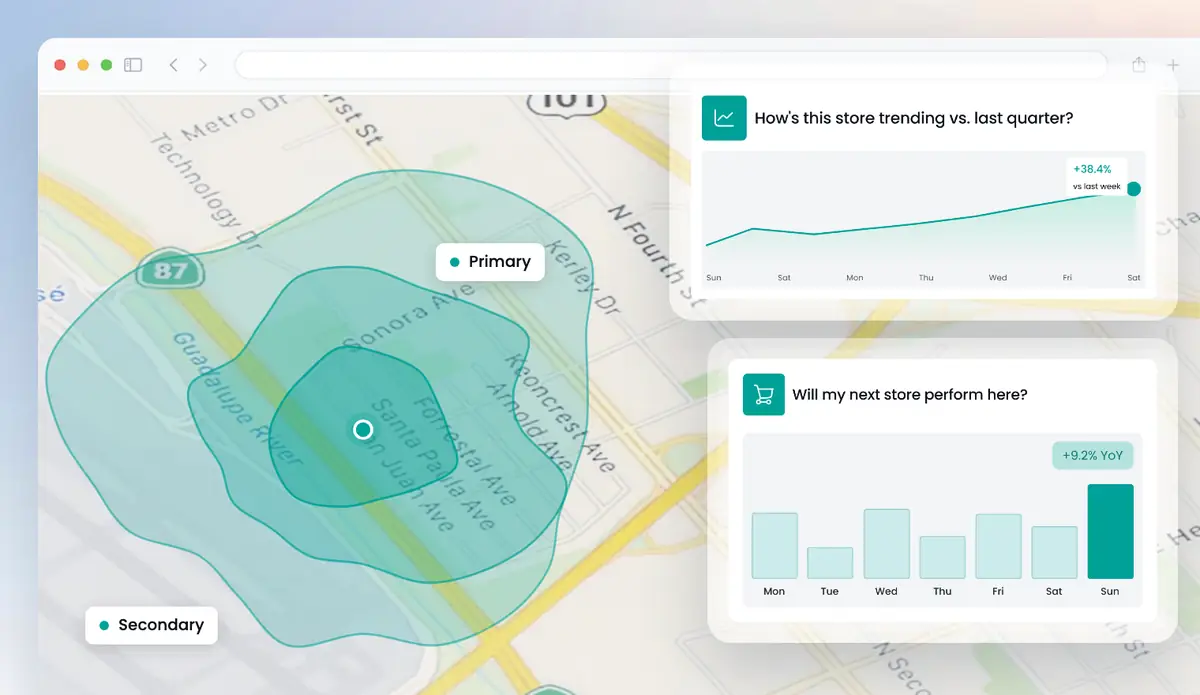
Get a free analysis of your locations
Up to 5 locations. No cost, no commitment.
Huq is location intelligence software for retail, property and investment teams in the Nordics. It shows how many people visit any address, where they come from and how they behave there. It works for a city centre store, a shopping centre or a competitor's site. Huq publishes its accuracy by country, with a 19.5% MAPE across published markets, against a 30% healthy threshold.
How Huq's location intelligence software works
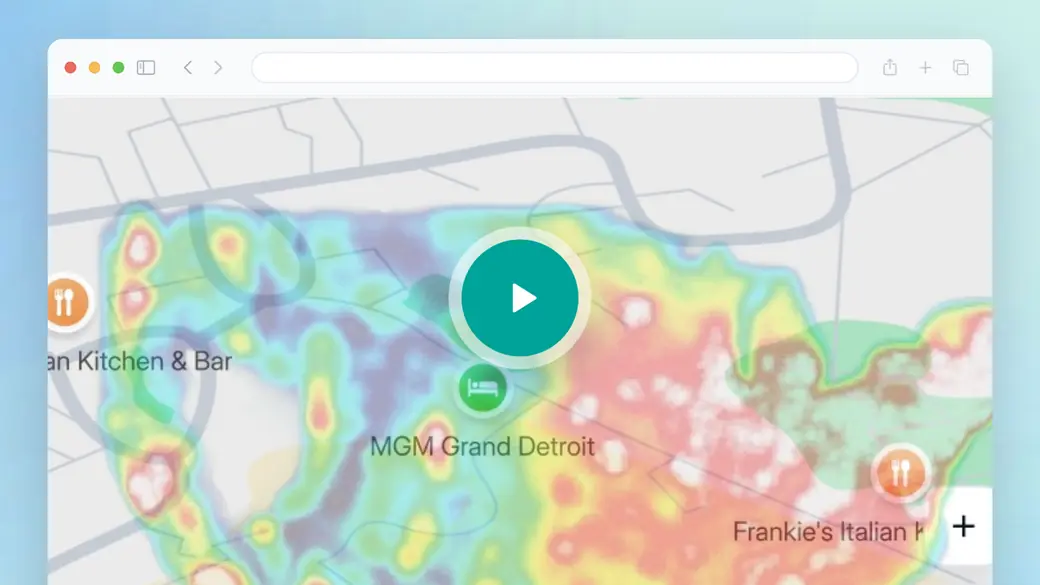
Location intelligence software should spare you building maps and models from scratch. In this Huq overview, look for what comes ready to use: the Explore map and its layers, footfall and catchment for one address, and Projects for following many sites. Picture a Nordic shopping centre you know and ask how quickly each step would answer a question about it.
- The Explore map, with layers for shopping centres, brands and postcodes
- Footfall, catchment and travel time in km for one address
- Projects for monitoring many sites, with exports and PDF reports
Trusted by 300+ organisations · Data across 35 markets






What is location intelligence software?
Location intelligence software helps teams decide where, using data about places and people. It is often confused with GIS. A GIS is a general tool for building maps and spatial models. Location intelligence software is narrower. It comes with the data and answers set business questions.
Huq is location intelligence built on observed footfall and behaviour. For any address you get visits over time, visiting vs passing traffic, catchment by postcode, dwell time and cross-visitation. Your GIS team can still use the data: weekly feeds go into Amazon S3 or Google Cloud Storage.
In the Nordics, buyers are often retail chains planning expansion, shopping centre owners reporting to tenants, and investors checking retail assets. Municipalities use it to see whether a city centre investment changed footfall and dwell, compared with similar towns. Two examples: comparing two shopping centres for a new store, or testing if a retail park still pulls visitors after a rival opens nearby.
What's in Huq's location intelligence software
01
Footfall for any address
Footfall by week, month and year, so seasonal peaks and quiet months are easy to compare.
02
Catchment and travel time
The postcodes visitors come from, with drive-time and travel-time areas measured in km.
03
Visitor behaviour
Dwell time, visit frequency, dayparts, cross-visitation and international visitation for tourism.
04
White Space Analysis
Find gaps in your store network and test candidate sites on the map.
What Huq's location intelligence shows for a Nordic site
Three views, shown for a shopping centre.
01
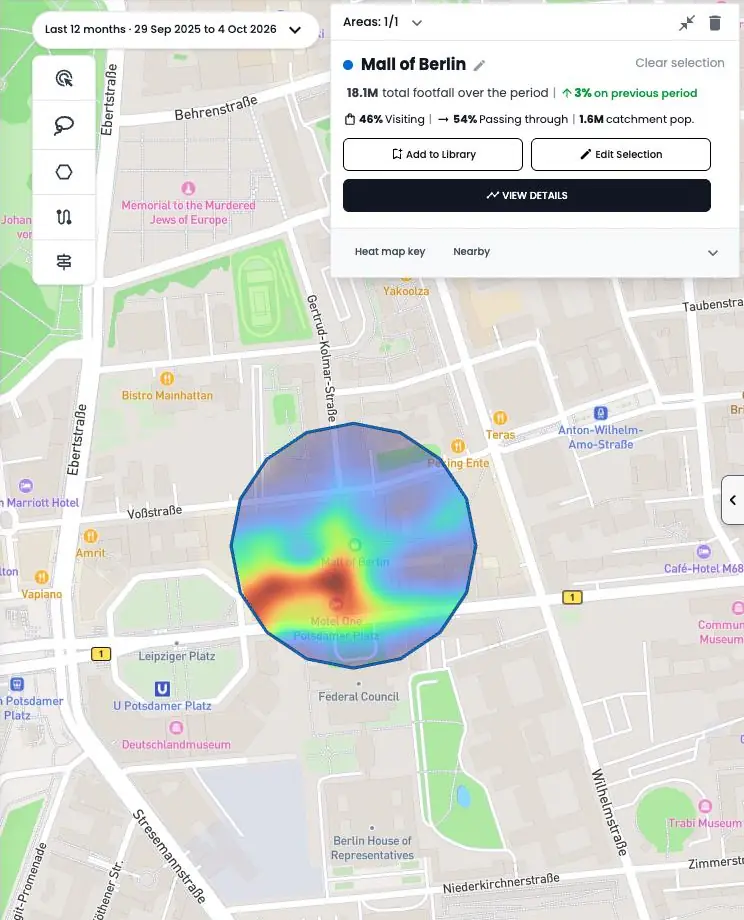
Explore map
Draw an area or use layers for retail centres, brand locations and industries. Heat maps show visiting vs passing traffic around the centre.
02
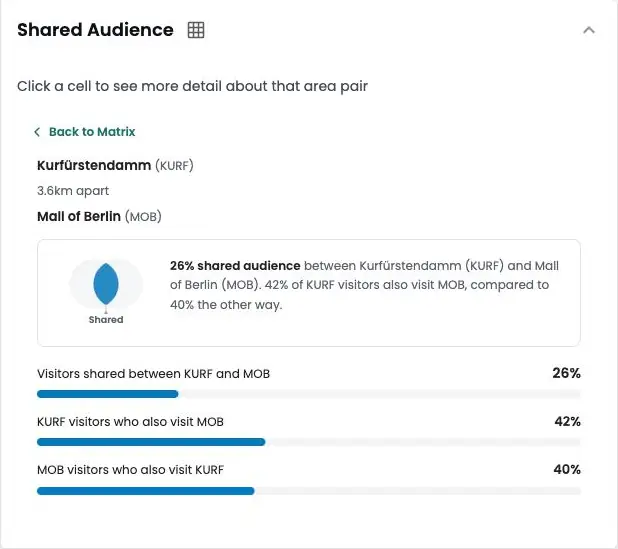
Cross-visitation
See which other places your visitors also go to, across up to 10 location pairs. Useful for tenant mix and competitor checks.
03
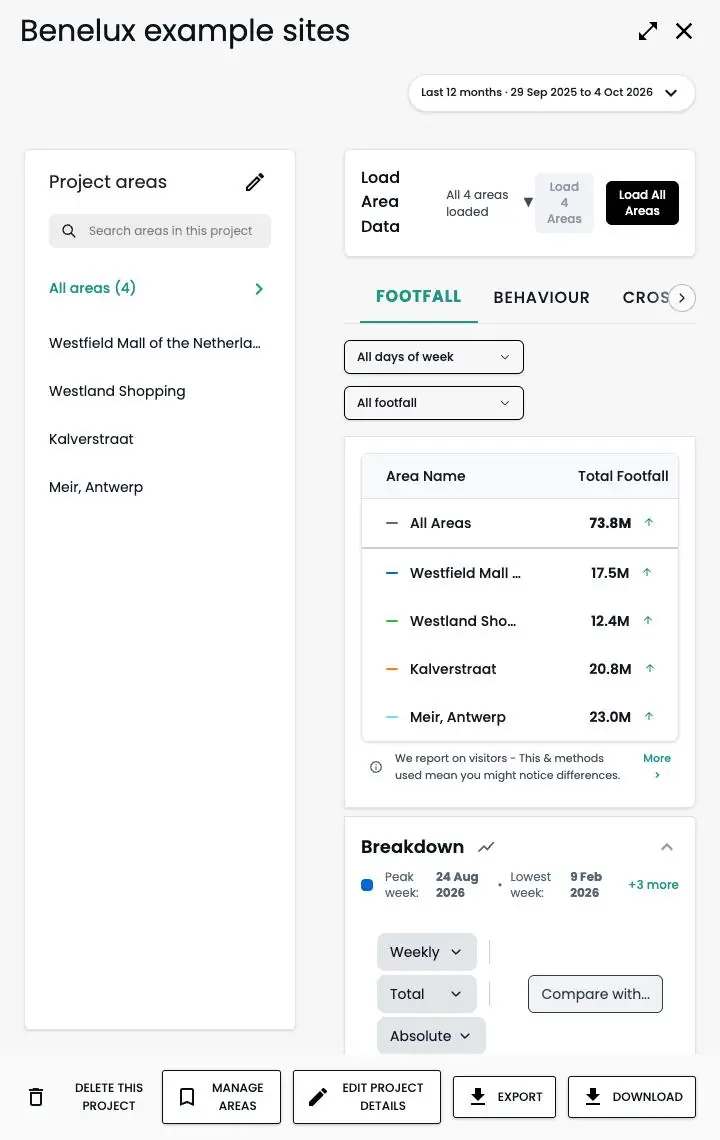
Projects
Track all your sites in folders, follow their status, and send stakeholders a monthly PDF report with trends against benchmarks.
Location intelligence software for the Nordics
How it works
Step 1
Tell us your locations
Add up to five addresses in the form. Your own stores, candidate sites or competitors.
Step 2
We run the analysis
Our team maps each location from observed visitor data.
Step 3
We walk you through it
A short call to take you through what the data shows and what it means for you.
Why Nordic teams choose Huq for location intelligence
Who it's for
01
02
03
About Huq
Huq is a location intelligence company. We turn anonymised mobile location data into footfall, catchment and visitor insight for any place, so retailers, property owners and local authorities can make decisions on evidence.
See how your locations really perform
Up to 5 locations. No cost, no commitment.