
Nordic footfall analytics
·
Footfall analytics for Nordic stores and shopping centres
Weekly visitor trends, benchmarks and competitor comparison for any address in Huq's Nordic markets. No counters needed.
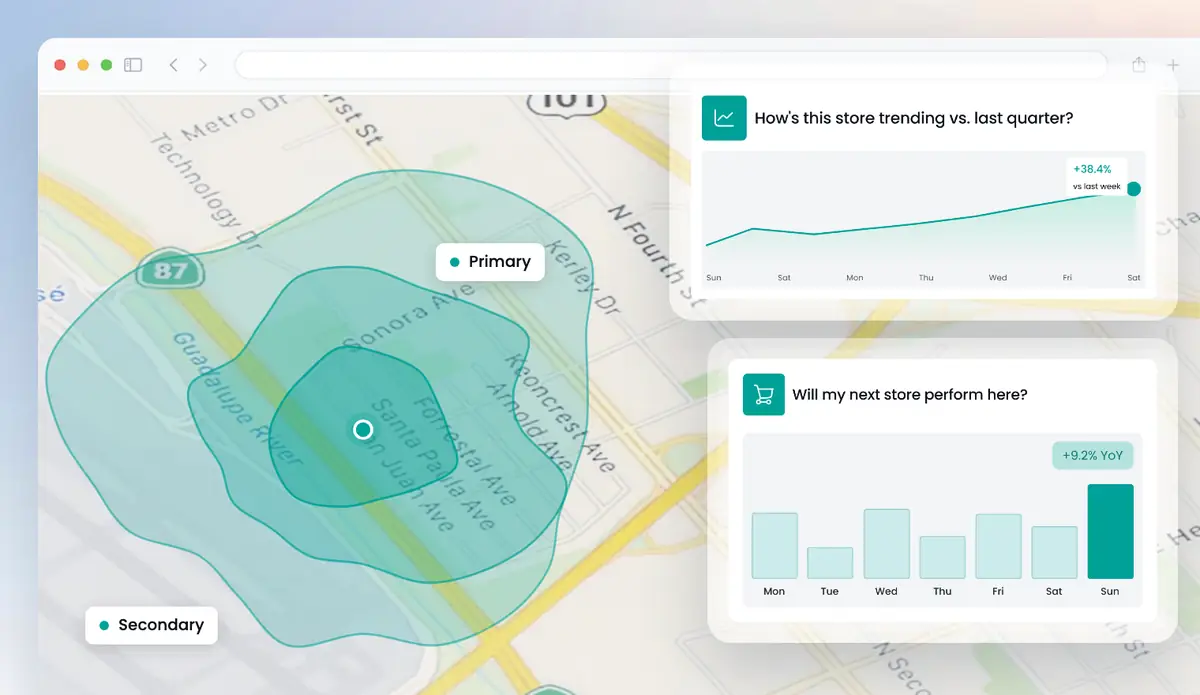
Get a free analysis of your locations
Up to 5 locations. No cost, no commitment.
Huq's footfall analytics shows how any store, shopping centre or city centre in its Nordic markets is performing. Compare a site with competitors and with regional and national trends. See which hours and weekdays are busiest, how long people stay and how often they return. Then share it all in a monthly PDF report. There are no counters to install, so you can also analyse sites you don't own.
Footfall analytics in Huq: three things to watch
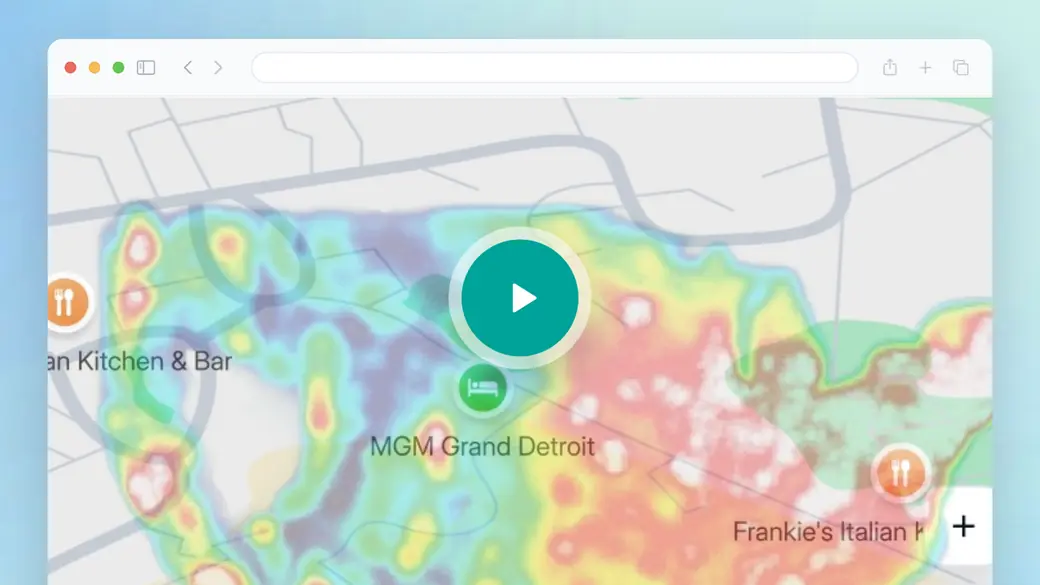
The overview is a general tour of Huq. For Nordic sites, note that trends can be viewed by week, month and year. Seasons shift footfall a lot in the Nordics, so year-on-year change is often the fairer test. Then note Projects, where a set of stores or shopping centres would be grouped and reported on together.
- Weekly trends with benchmarks and period-on-period change.
- Busiest hours, weekday patterns and dwell for each site.
- Projects to track many locations and report on them.
Trusted by 300+ organisations · Data across 35 markets






What is footfall analytics?
Footfall analytics explains changes in visitor numbers, not just the totals. In the Nordics that matters because footfall moves a lot with the seasons. A quiet January says little on its own. Compared with last January, with the regional trend and with competing centres, it tells you whether a site is slipping. In Sweden this work is often called besöksräkning or besöksstatistik.
Many Nordic shopping centres and retailers already count visitors at their own entrances. That covers their own doors. Huq adds the wider view: it covers any address, so you can compare with competitors, other centres and sites before you sign a lease. Municipalities use the same view to check whether a city centre investment lifted footfall and dwell, compared with similar towns.
Huq publishes its accuracy by country, as MAPE against landlord-reported footfall. Across published markets the median is 19.5%, well under the 30% healthy threshold. Huq also has 800+ validated target areas across Europe.
What's in your footfall analysis
01
Year-on-year benchmarks
Each site's trend against last year and against regional and national footfall, so seasons don't mislead.
02
Competitor comparison
Your store next to rival stores and centres nearby, on the same measure.
03
Hours, dwell and frequency
Busiest hours, time spent at each location and how often visitors come back.
04
Monthly PDF reports
KPIs, benchmarks, weekday patterns, density map, catchment, dayparts and dwell, ready to share.
What footfall analytics shows in the Nordics
Three views teams use to explain performance to managers, tenants and owners.
01
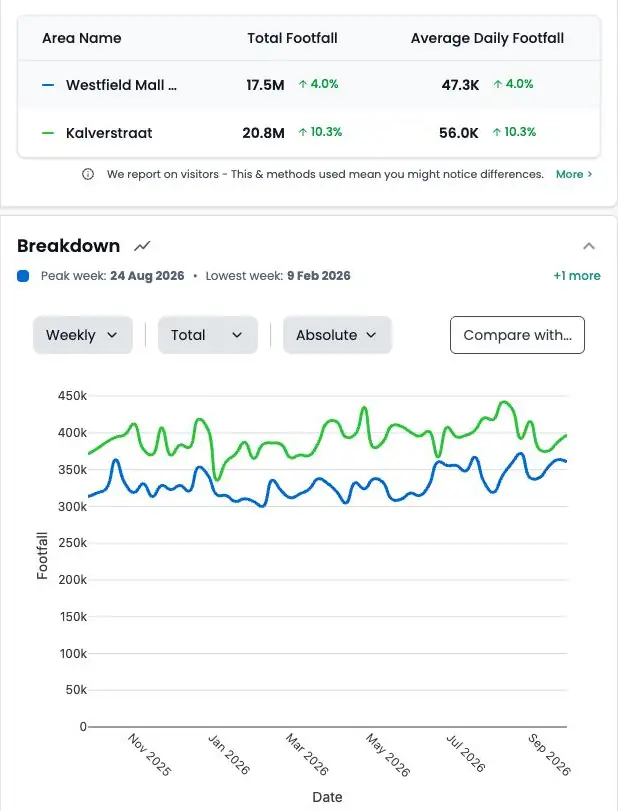
Site vs last year
A site's weekly footfall against the same period last year and against regional and national trends.
02
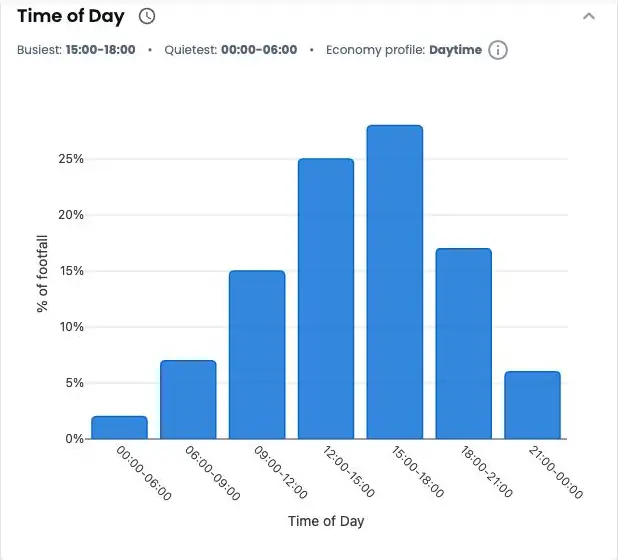
Hours and weekdays
See the busiest hours and days. Check opening hours, staffing and campaigns against them.
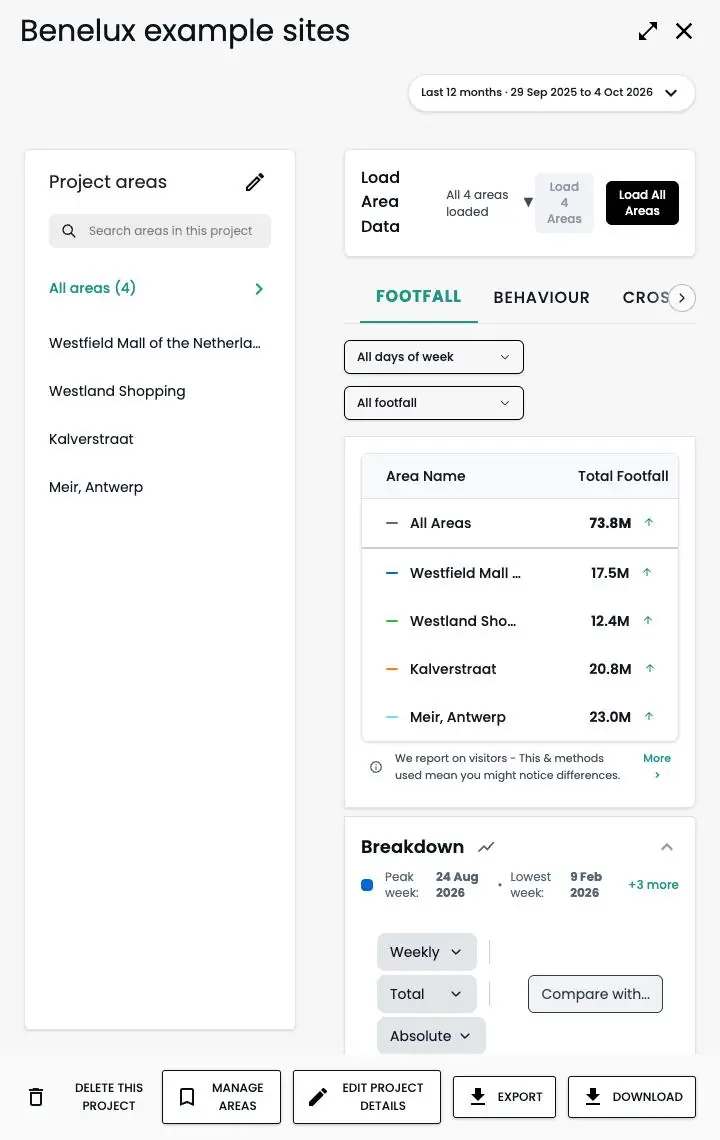
03
All sites in Projects
Group stores or shopping centres, track each one's status and share one consistent report.
Footfall analytics coverage in Huq's Nordic markets
How it works
Step 1
Tell us your locations
Add up to five addresses in the form. Your own stores, candidate sites or competitors.
Step 2
We run the analysis
Our team maps each location from observed visitor data.
Step 3
We walk you through it
A short call to take you through what the data shows and what it means for you.
Why Nordic teams use Huq for footfall analytics
Who it's for
01
02
03
About Huq
Huq is a location intelligence company. We turn anonymised mobile location data into footfall, catchment and visitor insight for any place, so retailers, property owners and local authorities can make decisions on evidence.
See how your locations really perform
Up to 5 locations. No cost, no commitment.