
Mobility data
·
Mobility data for Benelux city centres and shopping streets
See how people reach and use places in the Netherlands, Belgium and Luxembourg. Weekly data, in the platform or as Parquet and CSV files.
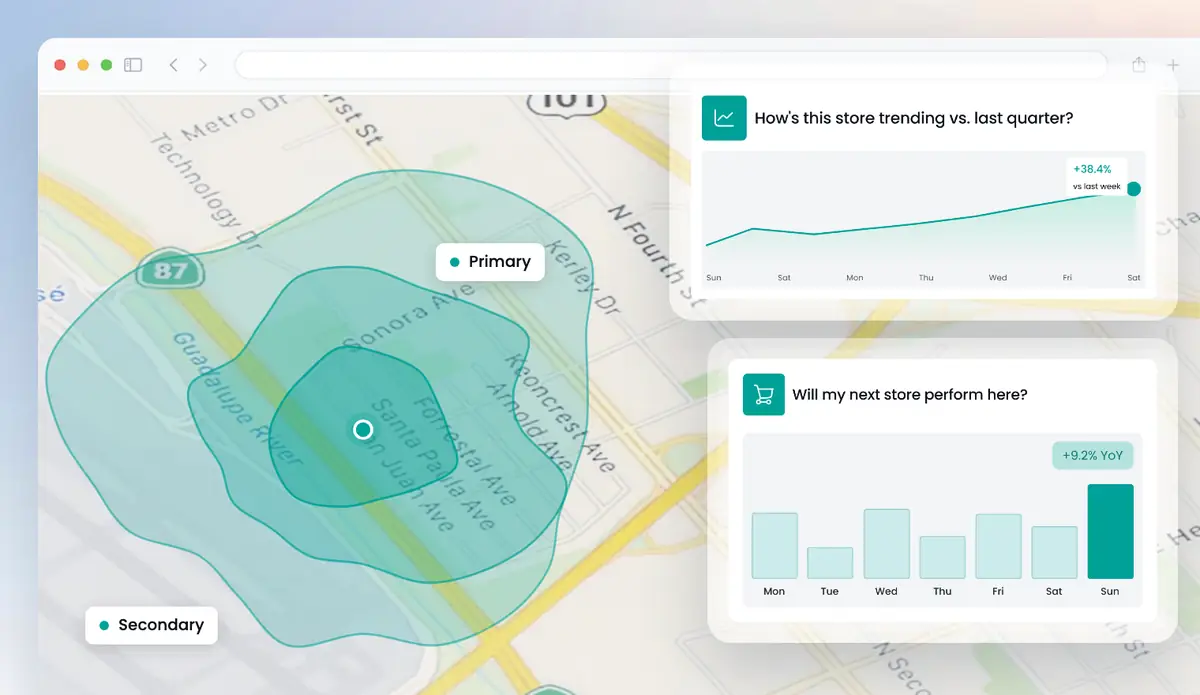
Get a free analysis of your locations
Up to 5 locations. No cost, no commitment.
Huq's mobility data shows how people reach and use places in the Netherlands, Belgium and Luxembourg. Pick a city centre, a shopping street, a station area or a shopping centre. You see footfall, residents versus visitors, how people arrive, how dense the crowds are and which postcodes they come from. Data refreshes weekly, as Parquet or CSV files in Amazon S3 or Google Cloud Storage, or as exports.
See mobility data on the Huq map
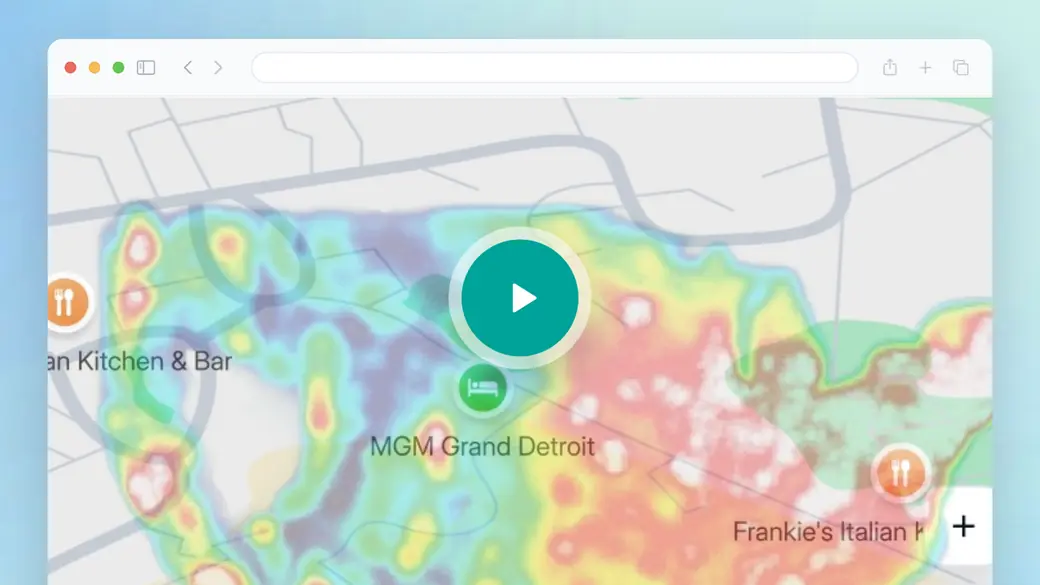
Pay attention to the Explore map layers in this overview: visiting and passing traffic, catchment and travel time. Together they describe how a Benelux place is reached and used. Unlike open transport data, they start from the destination, not the network. The data behind each view can be exported or received in a weekly file.
- Visiting and passing traffic shown as a heat map.
- Catchment and travel-time layers in km.
- Exports with the same fields as the data feed.
Trusted by 300+ organisations · Data across 35 markets






What is mobility data for places?
The Netherlands and Belgium have a lot of open mobility data: public transport feeds, cycle counts and road traffic. That data tells you how the network works. It does not tell you how busy a shopping street is, or who visits it.
Huq's mobility data starts from the place. For any address it shows footfall over time, the split between residents and visitors, transport mode, footfall density across an area and catchment flows by postcode. Retail chains use it to compare stores. Owners use it to report on shopping centres. Municipalities use it to follow city centres week by week, and to check whether a city centre policy changed footfall compared with similar towns.
Huq publishes its accuracy by country against landlord-reported footfall: 15.7% MAPE in the Netherlands and 17.0% in Belgium. Data refreshes weekly.
What's in your Benelux mobility data
01
Footfall over time
Weekly, monthly and yearly footfall, with visiting versus passing traffic.
02
Residents and visitors
Local residents versus people travelling in, including international visitors for tourism.
03
Transport mode and density
How people arrive and where footfall concentrates within a city centre.
04
Catchment flows
Where visitors come from, by postcode and travel time in km.
What Benelux mobility data shows
Three views that explain how a place is used.

01
Crowd density in a centre
A heat map of visiting and passing traffic across a Dutch or Belgian city centre.

02
Who visits
Weekly split of residents and visitors, so you can see the effect of tourism, events or new transport links.

03
Catchment by postcode
Postcodes ranked by visitor numbers, with travel-time bands in km. See whether a centre draws only from nearby or from further afield.
Mobility data across the Benelux
How it works
Step 1
Tell us your locations
Add up to five addresses in the form. Your own stores, candidate sites or competitors.
Step 2
We run the analysis
Our team maps each location from observed visitor data.
Step 3
We walk you through it
A short call to take you through what the data shows and what it means for you.
Why Benelux teams use Huq for mobility data
Who it's for
01
02
03
About Huq
Huq is a location intelligence company. We turn anonymised mobile location data into footfall, catchment and visitor insight for any place, so retailers, property owners and local authorities can make decisions on evidence.
See how your locations really perform
Up to 5 locations. No cost, no commitment.