
Mall analytics
·
Mall analytics for shopping centres in Benelux
Visits, catchment, dwell and shared visitors for any shopping centre in Belgium, the Netherlands and Luxembourg. Weekly data.
Get a free analysis of your locations
Up to 5 locations. No cost, no commitment.
Mall analytics tells you how well a shopping centre works: how many people visit, when they come, how long they stay and where they live. Huq measures this for any shopping centre in Belgium, the Netherlands and Luxembourg, including your competitors' centres. Landlords and asset managers use it to plan tenant mix, support leasing and compare centres that sit only a short drive apart.
Mall analytics in Huq: what to look for
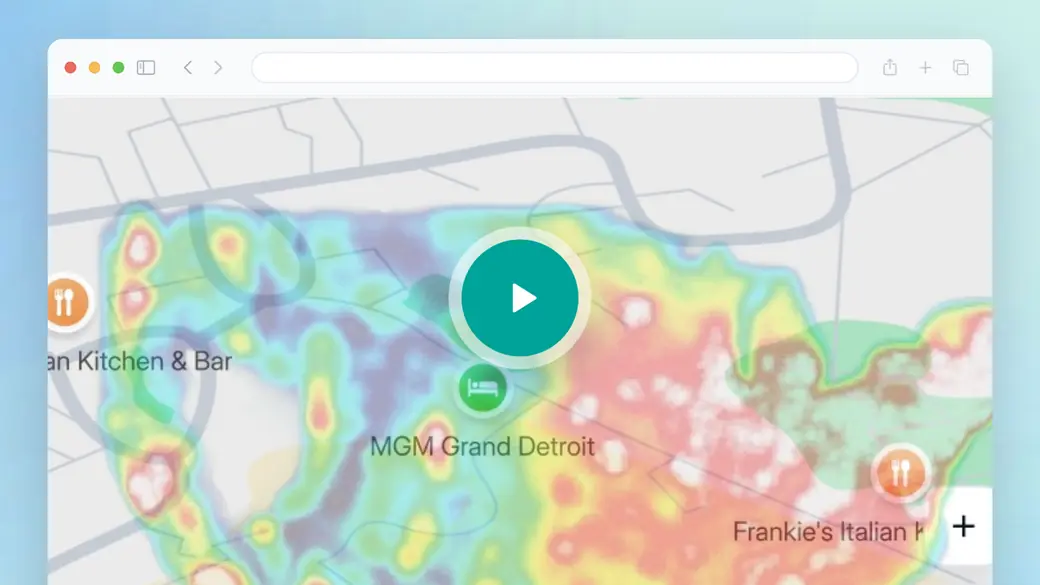
The overview shows the platform in general. For a shopping centre in Benelux, focus on the travel time and catchment layers on the Explore map. Centres here are often close together, so catchments overlap. Keep cross-visitation in mind too: it is how you would see how many visitors two centres share.
- Travel time layers in km around a centre
- Where catchments of nearby centres overlap
- Cross-visitation between two locations
Trusted by 300+ organisations · Data across 35 markets






What is mall analytics?
Mall analytics is the use of visit data to manage and value shopping centres. In Belgium, the Netherlands and Luxembourg, centres are often only a short drive apart. City centre shopping streets also compete for the same visitors. So the key question is often not "how many visitors?" but "whose visitors?"
Huq measures visits to the centre as a whole. It adds catchment by postcode, travel time, dwell time, dayparts and cross-visitation between up to 10 location pairs. You can see which centres share your visitors and which postcodes you are losing. Huq is not an in-centre sensor system. It does not count by corridor or by entrance.
Accuracy is published by country: 15.7% MAPE in the Netherlands and 17.0% in Belgium, against landlord-reported footfall.
What's in your mall analytics
01
Weekly centre visits
Visits, average daily footfall and trends for your centre and every centre nearby.
02
Overlapping catchments
Postcode catchment and travel time show where your catchment overlaps with rival centres.
03
Shared visitors
Cross-visitation shows how many visitors you share with another centre or shopping street.
04
Dwell and dayparts
See how long people stay and which times of day are busy or quiet.
What mall analytics shows for your centre
Three views that help landlords and asset managers in Benelux compare shopping centres.
01
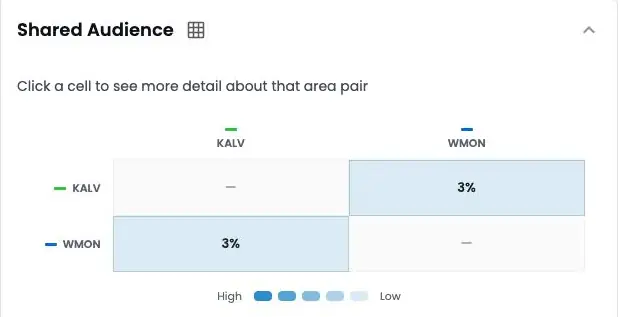
Whose visitors
Cross-visitation between your centre and nearby centres shows where you compete directly and where you don't.
02
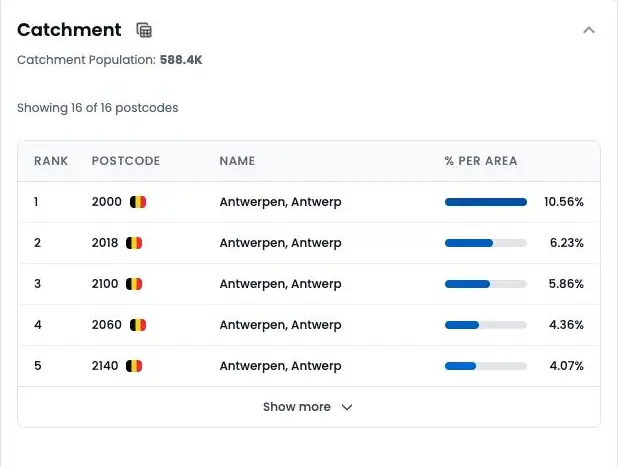
Catchment by postcode
See which postcodes your visitors come from, how far they travel in km, and which nearby areas under-visit.
03
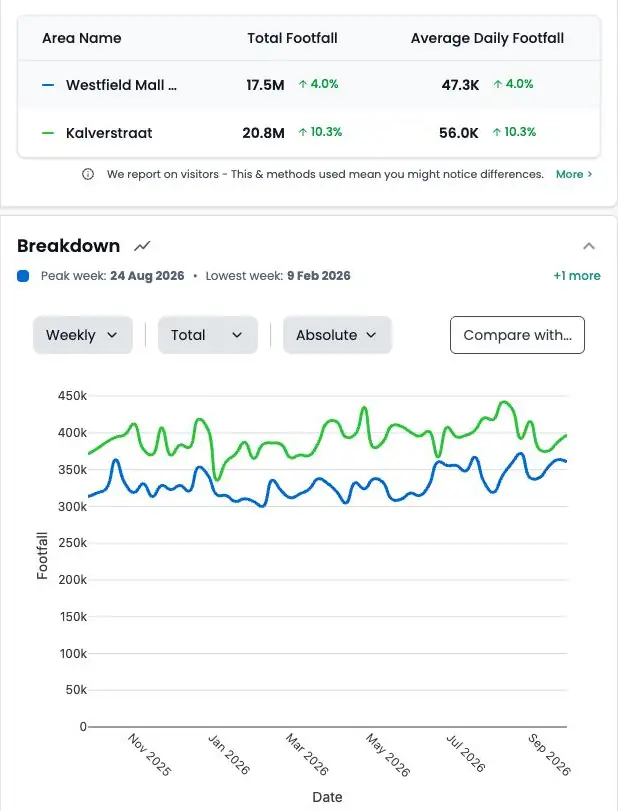
Trends against rivals
Weekly visit trends for your centre and its competitors on one chart, ready for leasing and investor reports.
Mall analytics in Belgium, the Netherlands and Luxembourg
How it works
Step 1
Tell us your locations
Add up to five addresses in the form. Your own stores, candidate sites or competitors.
Step 2
We run the analysis
Our team maps each location from observed visitor data.
Step 3
We walk you through it
A short call to take you through what the data shows and what it means for you.
Why Benelux landlords use Huq for mall analytics
Who it's for
01
02
03
About Huq
Huq is a location intelligence company. We turn anonymised mobile location data into footfall, catchment and visitor insight for any place, so retailers, property owners and local authorities can make decisions on evidence.
See how your locations really perform
Up to 5 locations. No cost, no commitment.