
Store cannibalisation analysis
·
Cannibalization analysis for your store network
See how much your stores share catchments and customers before a new opening takes trade from sites you already run in Australia and New Zealand.
Get a free analysis of your locations
Up to 5 locations. No cost, no commitment.
Cannibalization analysis shows whether a new or existing store is taking customers from the rest of your own network. Huq maps each store's catchment by postcode, measures how many visitors your sites share, and tracks weekly footfall at existing stores before and after an opening. It works on any address in Australia and New Zealand, including sites you haven't opened yet, so you can test a shortlist before you sign a lease.
How cannibalization analysis works in Huq
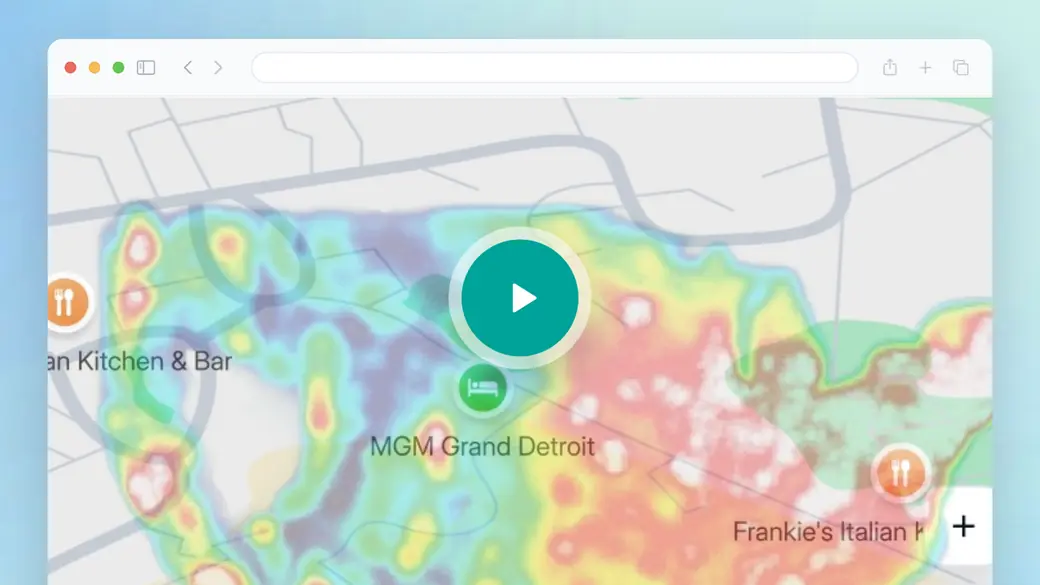
This overview walks through the Huq platform as a whole, not a cannibalization case. Use it to judge the pieces you would rely on: drawing a catchment or travel-time area around any address, placing a proposed site next to your existing stores, and reading weekly footfall trends. Those are the building blocks for checking overlap before and after an opening.
- Draw a catchment or travel-time area around a proposed site and your nearest stores.
- Compare shared visitors between your stores, for up to 10 location pairs.
- Check weekly footfall at existing stores before and after a new opening.
Trusted by 300+ organisations · Data across 35 markets






What is cannibalization analysis?
In retail, cannibalisation is when a new store wins customers who would otherwise have used one of your existing stores. Network sales grow by less than the new store takes, and a profitable site can slip below target. Cannibalisation analysis measures that overlap before you commit, then checks it after you open.
In Australia and New Zealand the risk is sharpest in growth corridors and in metro areas where a chain already has a shopping centre store, a CBD store and strip retail sites within a short drive of each other. Franchise networks face a second question: will a new store hurt an existing franchisee's trade?
Huq doesn't measure sales. It gives you the location side of the answer: each store's catchment by postcode, how far it overlaps with a proposed site, how many visitors already go to both, and how weekly footfall moves once the new store trades. Set that against your own sales to put a value on it.
What's in your cannibalisation analysis
01
Catchment overlap by postcode
See which postcodes feed both a proposed site and your existing stores, and how much of each catchment is shared.
02
Shared visitors between stores
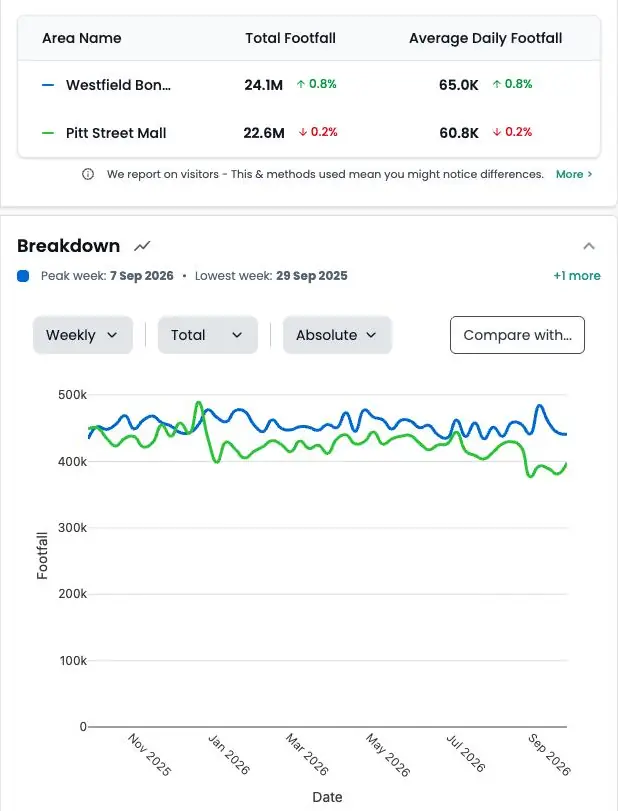
Cross-visitation shows the share of visitors two of your stores have in common, across up to 10 location pairs.
03
Before-and-after footfall
Weekly footfall at nearby stores shows whether visits fell after a new opening, and by how much.
04
Travel-time catchments
Drive-time and travel-time areas show how far customers will realistically travel between your sites.
What a cannibalisation analysis shows
Three views take you from a proposed site to a clear answer on overlap with your existing stores.
01
Catchments side by side
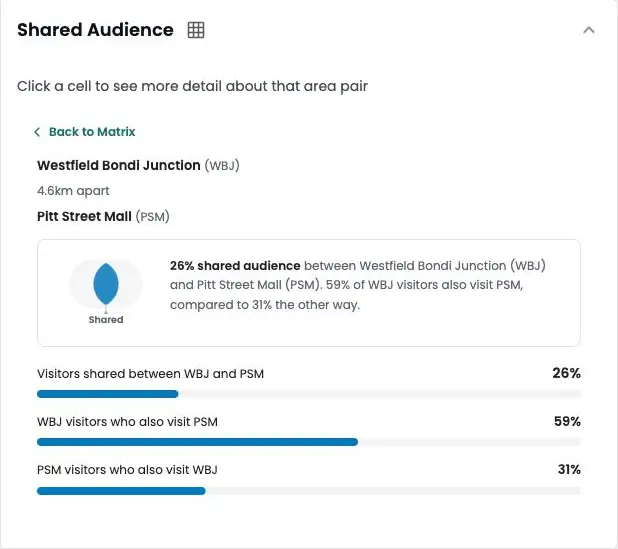
Plot a proposed site and your nearest stores on the Explore map, then compare their catchments by postcode to see where they overlap.
02
Cross-visitation between your stores
Measure how many visitors already go to two of your stores, so you can tell real overlap from stores that serve different customers.
03
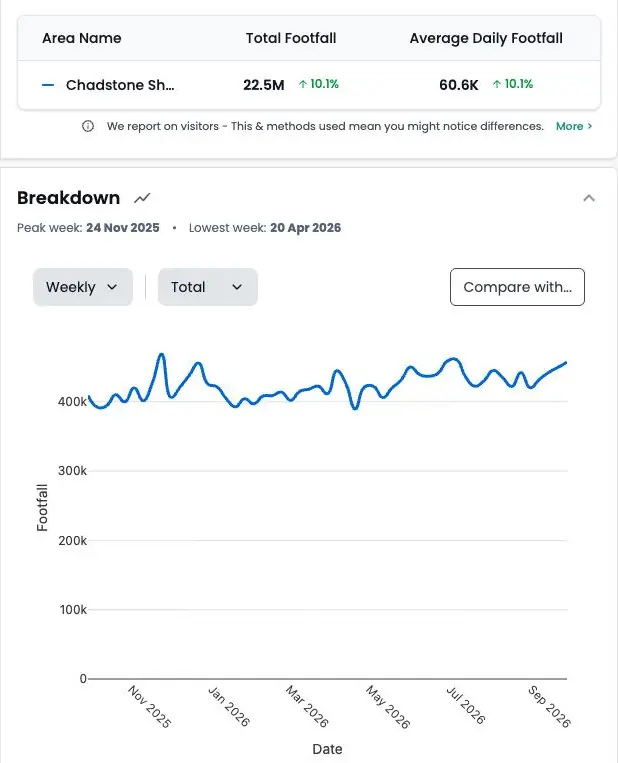
Footfall after an opening
Track weekly footfall at existing stores against the period before the new store opened, and against regional benchmarks in the monthly PDF report.
Cannibalization analysis across Australia and New Zealand
How it works
Step 1
Tell us your locations
Add up to five addresses in the form. Your own stores, candidate sites or competitors.
Step 2
We run the analysis
Our team maps each location from observed visitor data.
Step 3
We walk you through it
A short call to take you through what the data shows and what it means for you.
Why retailers use Huq for cannibalisation analysis
Who it's for
01
02
03
About Huq
Huq is a location intelligence company. We turn anonymised mobile location data into footfall, catchment and visitor insight for any place, so retailers, property owners and local authorities can make decisions on evidence.
See how your locations really perform
Up to 5 locations. No cost, no commitment.