Make location your competitive advantage
Successful decisions are built on evidence. Huq’s extensive location data & analytics helps you pinpoint customer behaviours for better investment decisions.
Location intelligence trusted by 300+ industry leaders


Tailored location insights for every use case
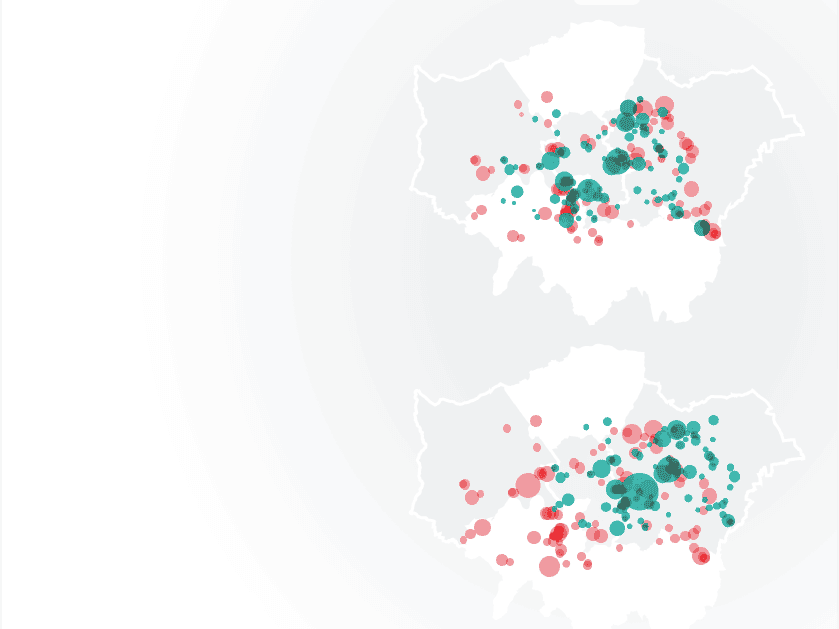
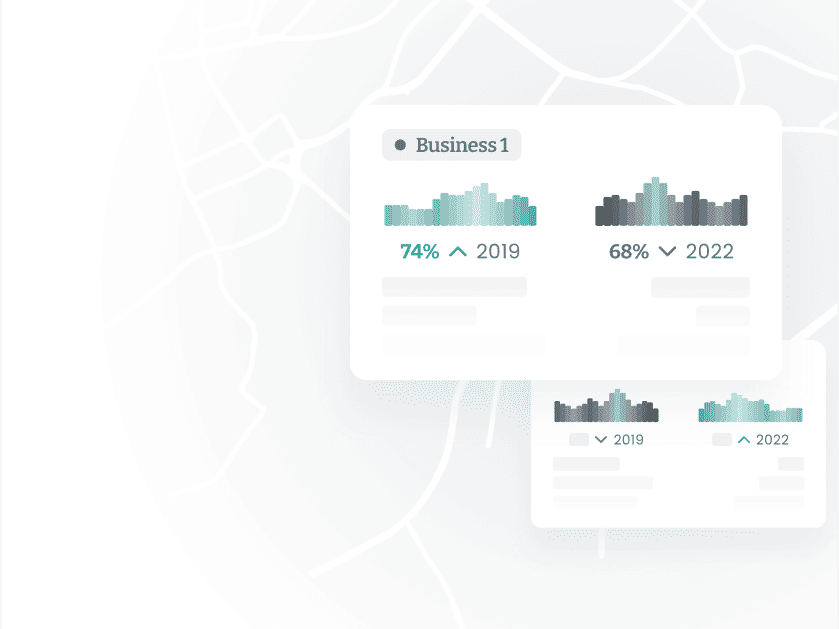
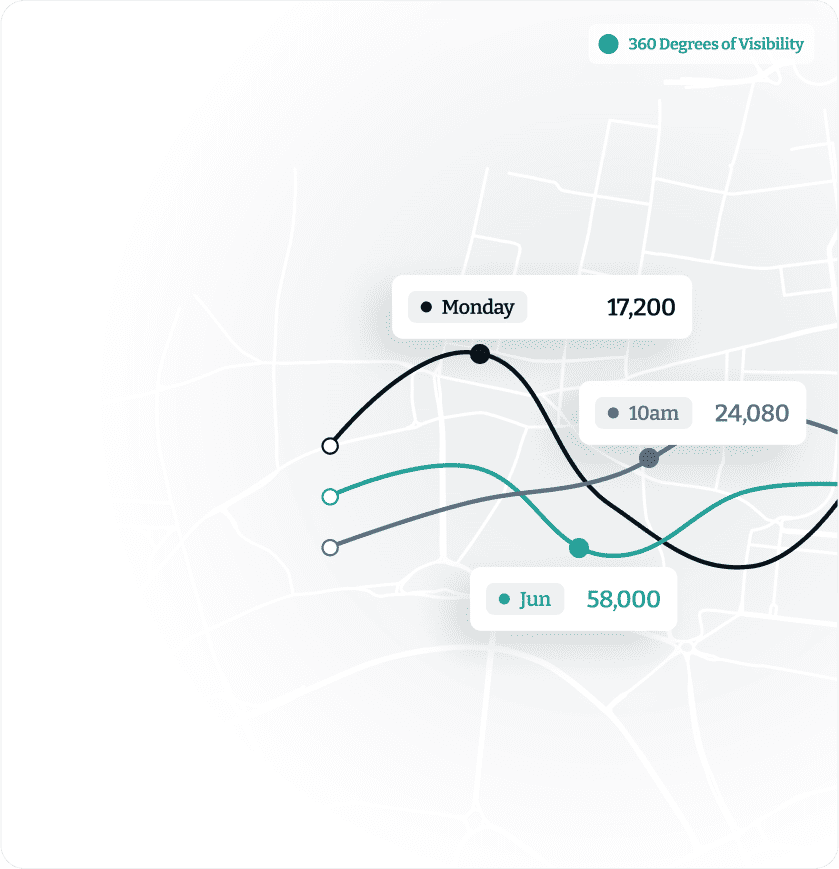
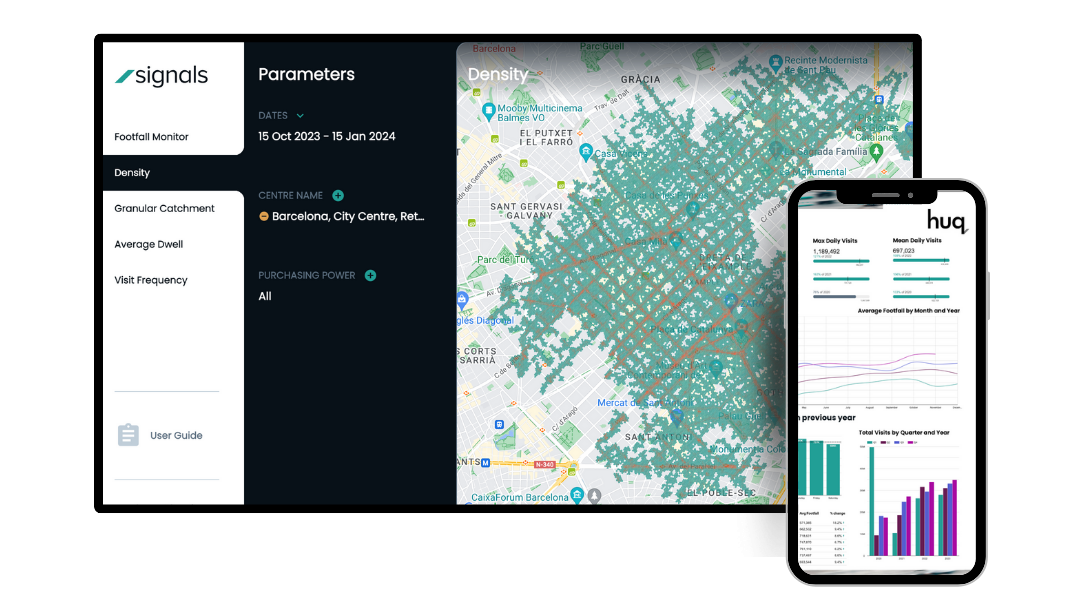
Uncover the true performance of your space
Leverage footfall traffic, movement patterns, and visit durations of any visitors to create a comprehensive picture of any time period and locations of interest.
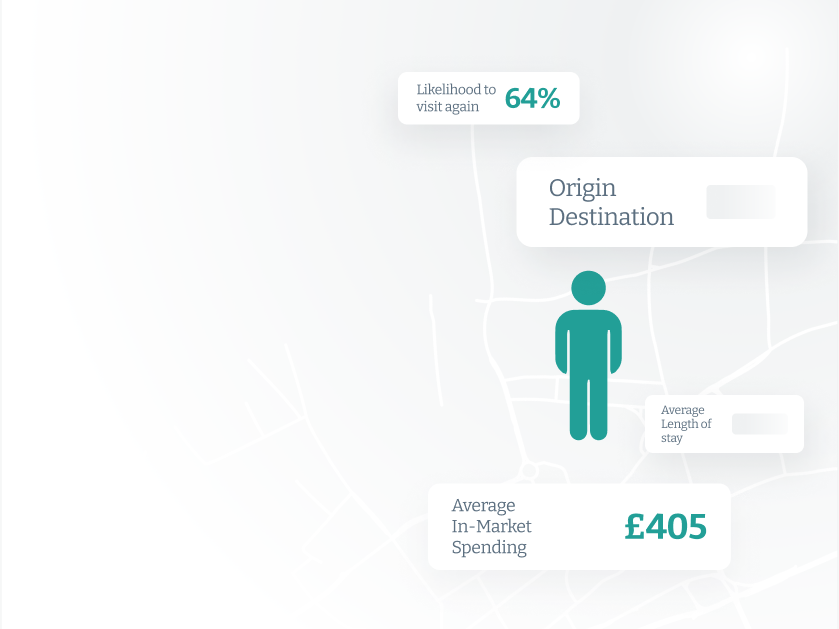
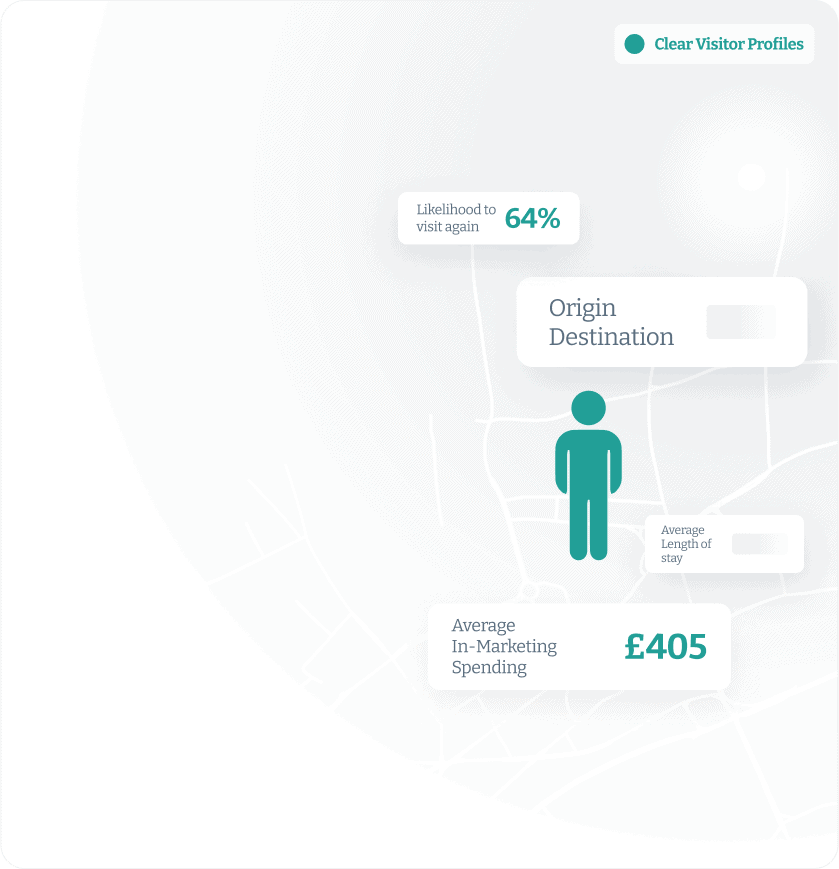
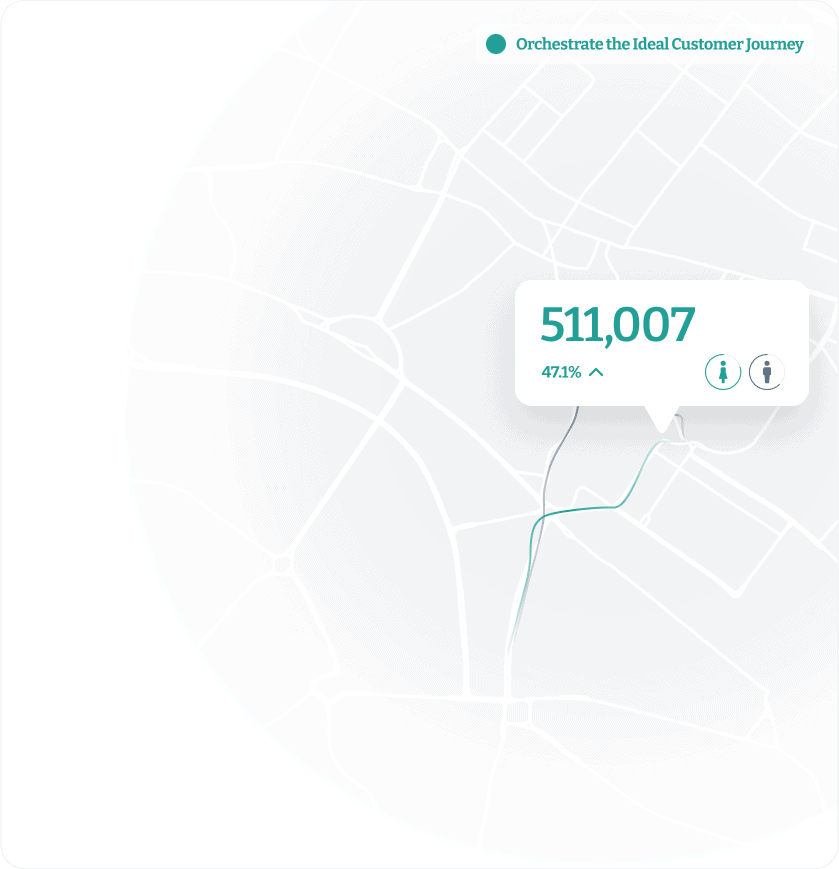
Pinpoint your audience
Identify demographics, preferences, behaviours, and seasonal trends with location data. See comprehensive profiles that paint a picture of behaviours and patterns of visitors, workers, and residents.
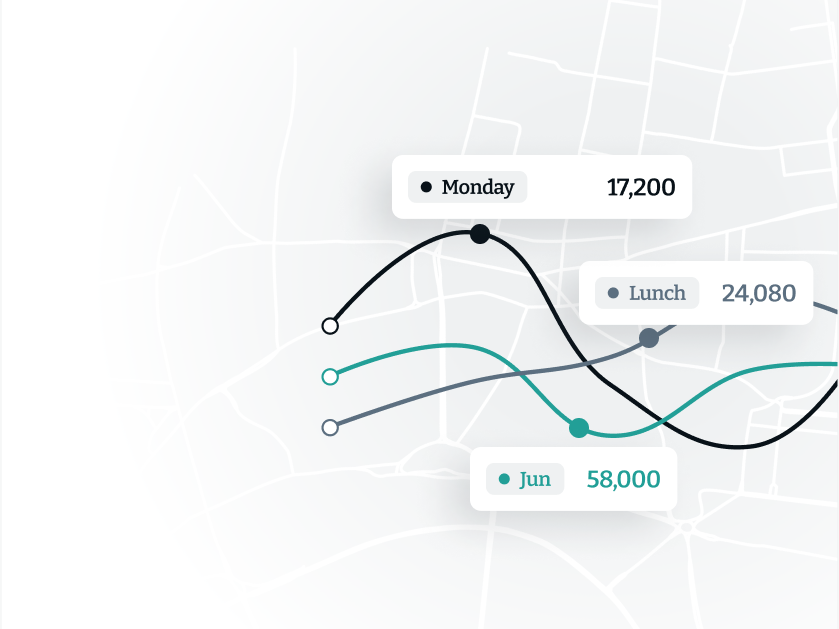
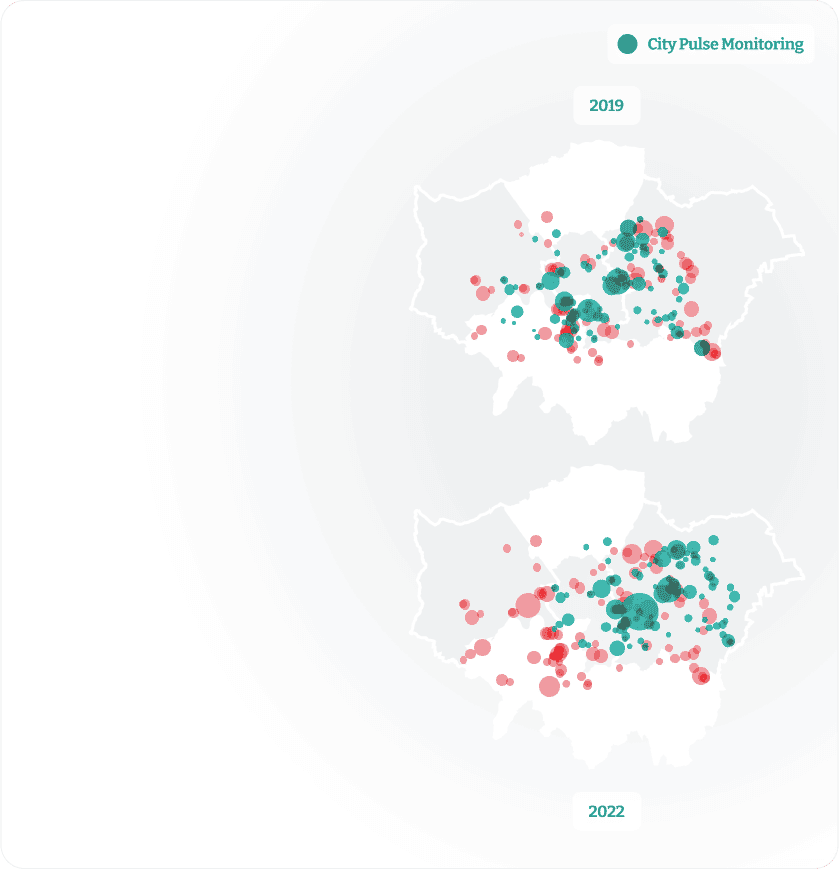
Identify trends and unique insights
Surface visitor patterns that indicate peak visit times, preferred locations, and typical routes, seasonal changes, and other behaviours.
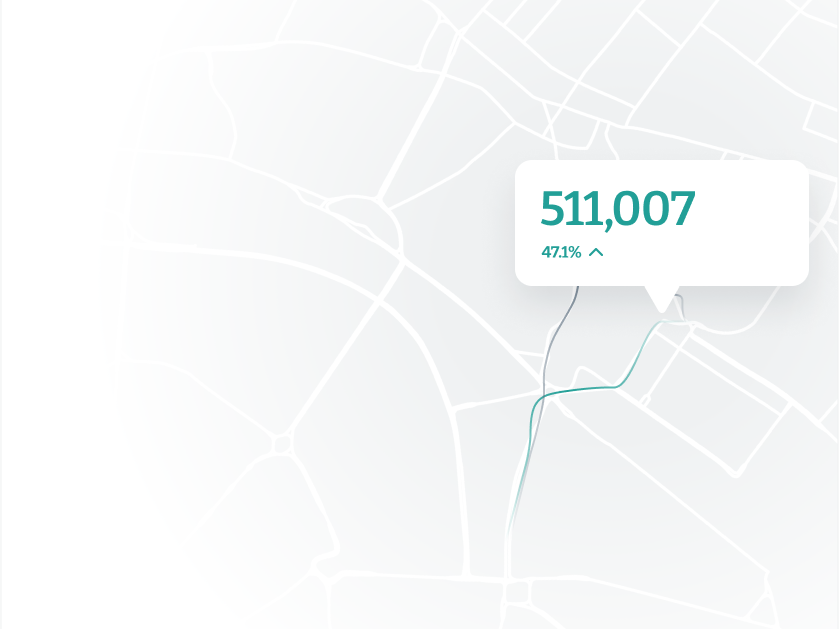
Map travel patterns
See origin-destination pairs and understand where people begin their journeys and where they end up to identify commuting patterns, popular travel routes, and the interconnectivity of different regions.
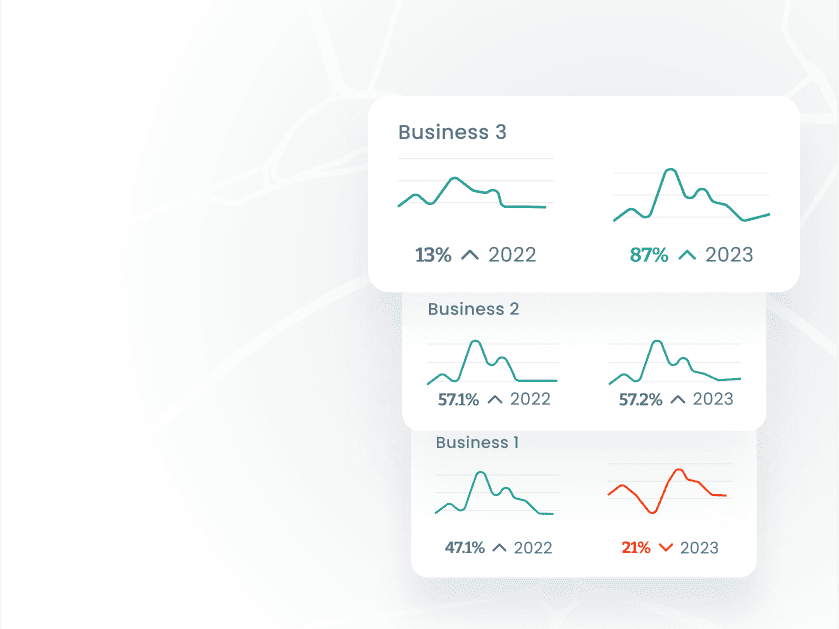
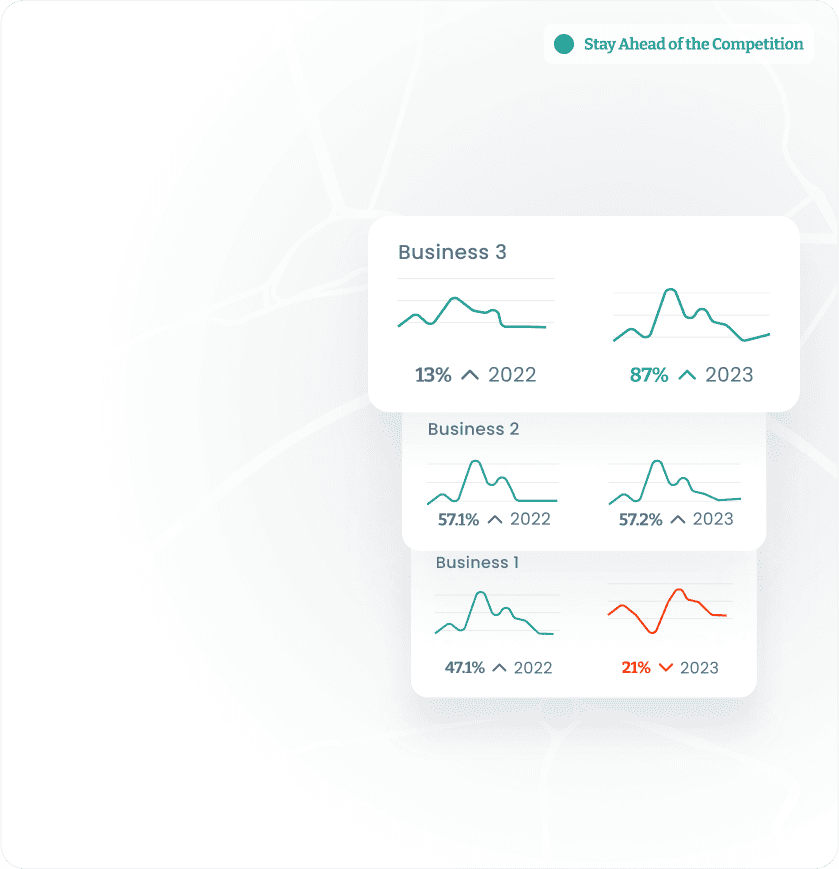
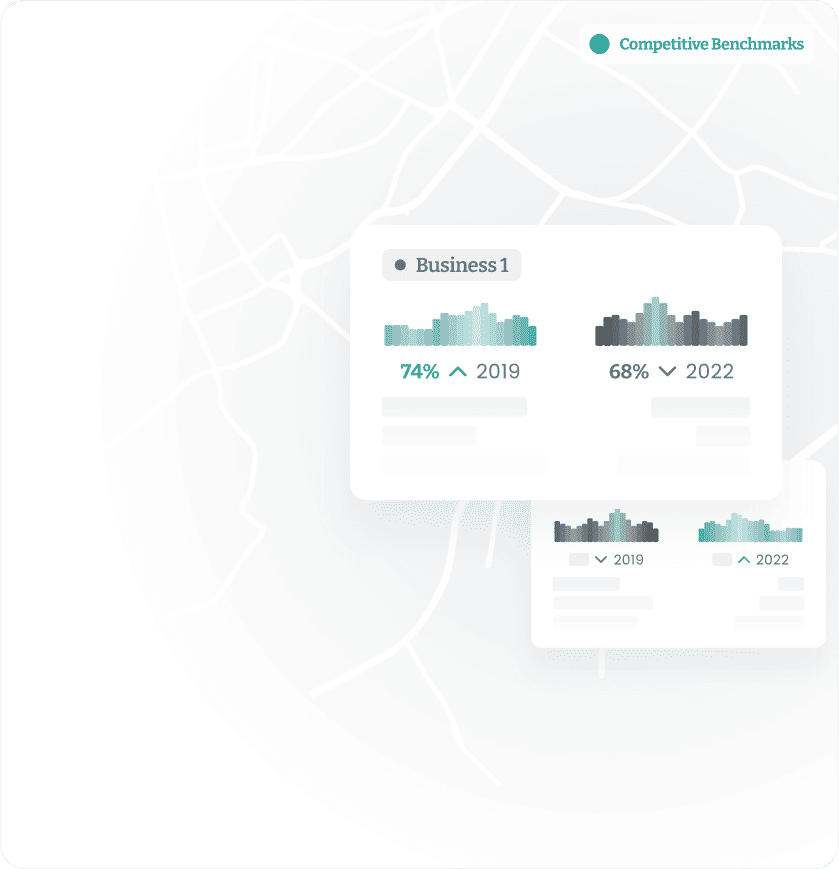
Benchmark performance across locations
Leverage universal location intelligence analytics to make 1 to 1 comparisons across the globe without micro-biasing factors.
Drive informed decisions
Leverage foot traffic, customer engagement, and visit patterns to monitor and adapt your strategies ahead of economic changes.
Leverage foot traffic, movement patterns, and visit durations of any visitors to create a comprehensive picture of any time period and locations of interest.
Identify demographics, preferences, behaviours, and seasonal trends with location data. See comprehensive profiles that paint a picture of behaviours and patterns of visitors, workers, and residents.
Surface visitor patterns that indicate peak visit times, preferred locations, and typical routes, seasonal changes, and other behaviours.
See origin-destination pairs and understand where people begin their journeys and where they end up to identify commuting patterns, popular travel routes, and the interconnectivity of different regions.
See how you compare to your competitors and identify areas where you excel and areas that require improvement with foot traffic trends, visit durations, and customer behaviour at both your locations and your competitors’ locations. Leverage a consistent location intelligence analytics to make 1 to 1 comparisons across the globe without micro-biasing factors.
Leverage foot traffic data, customer engagement, and visit patterns to monitor and adapt your strategies ahead of economic changes.
Find the right solutions for your diverse needs
Select your role to dive into how you can optimise your decision-making.
Financial Services
Unleash the full power of location data.
Boost your site performance and understand how your customers are using your space.
300+
Trusted industry leaders
5x
Speed to insight
426,328
Census output areas
"Very pleased we have switched to Huq Industries for our footfall reporting.”

Lucilla Bathurst
BID Manager, Ripon BID
"Huq helps us to make smarter evidence-led decisions.”
Lesley Crisp
Principal Economic Development Officer, Hertsmere Borough Council
"Through our work we have established that Huq's UK mobility data set provides a robust accurate means to understand real world behaviours across the UK and their spatial economic impact.”

John Gathergood
Professor of Economics at the University of Nottingham, Leader of the Data Driven Discovery Initiative (3DI)
"With Huq, I have access to mobility data every day of the year.”

Alberto Poltz Faggiani
Transport and Infrastructure Analyst, WSP