
retail site analytics
·
United Kingdom
Retail site analytics for any UK store or unit
See one site's footfall, catchment, dwell and local competition in detail, whether it's an open store or a unit you're thinking of taking.
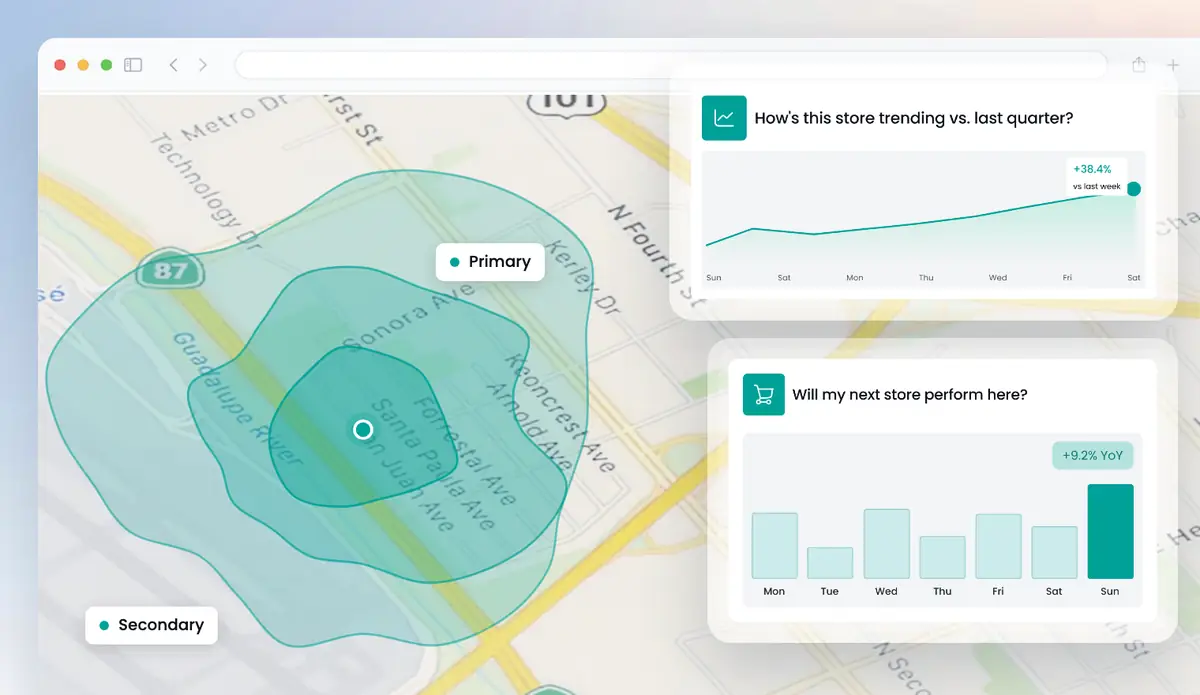
Get a free analysis of your locations
Up to 5 locations. No cost, no commitment.
We handle your details in line with UK GDPR.
Retail site analytics shows how a single UK site performs and why: footfall over time, where visitors come from, how long they stay and how the site compares with the stores and centre around it. Huq covers any address, from a high street unit to a retail park, so you can review an open store, test a vacancy before signing, or work out why one location trails the rest of your estate.
Retail site analytics, step by step in Huq
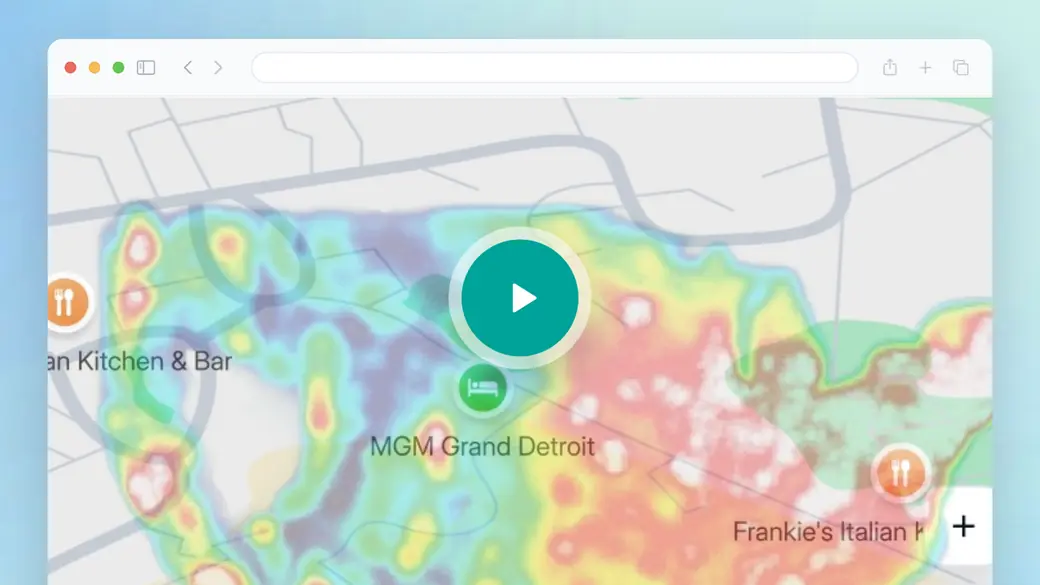
Huq's platform overview isn't specific to one site, but it shows how you would review one. Watch how a unit is drawn on the Explore map, which travel-time and catchment layers can sit around it, and what the monthly location report contains: footfall trend, dayparts, dwell and postcode catchment against regional and national benchmarks.
- Draw the unit or pick its shopping centre, retail park or high street.
- Layer travel time and catchment to see how far the site reaches, in miles.
- Put the site next to nearby competitors on the same measures.
Trusted by 300+ organisations · Data across 35 markets






What is retail site analytics?
Retail site analytics is the detailed study of one retail location. It covers footfall and its trend, visiting vs passing traffic, catchment, dwell time, busy hours and the competition nearby, so you understand the site rather than just its sales line.
UK retailers use it in three moments: before taking a unit, at lease renewal, and when a store underperforms. The core question is whether a weak result comes from the site or from the store. PizzaExpress answered it across 370+ UK stores by putting Huq's monthly footfall next to its own sales.
Huq measures any UK address without counters or cameras, including competitors' stores and sites you haven't opened. Data refreshes weekly, and Huq's published MAPE in Great Britain is 18.7%.
What's in your retail site analytics
01
Footfall and trend
Weekly, monthly and yearly footfall at the site, with average daily footfall and year-on-year change.
02
Postcode catchment
Which postcodes visitors come from, plus drive-time and travel-time areas in miles around the site.
03
Dwell, dayparts and frequency
How long visitors stay, when they come and how often they return.
04
Demographics and spend
Age, gender and purchasing power, plus geo-spend by category in the area, via Experian.
What retail site analytics shows
Three views from a typical single-site review.
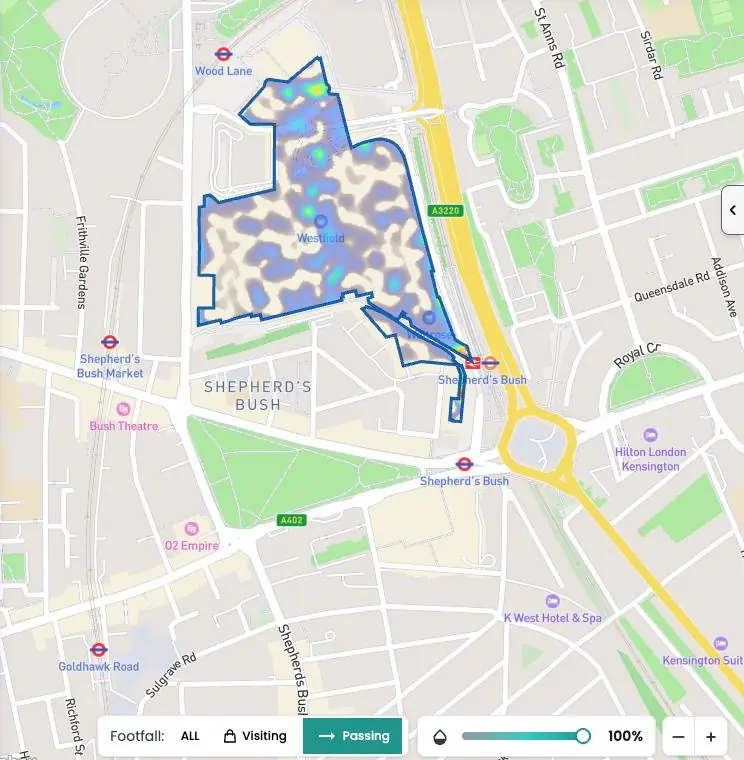
01
Visiting vs passing traffic
A heat map of people who stop at the site compared with those who walk past, showing frontage potential.
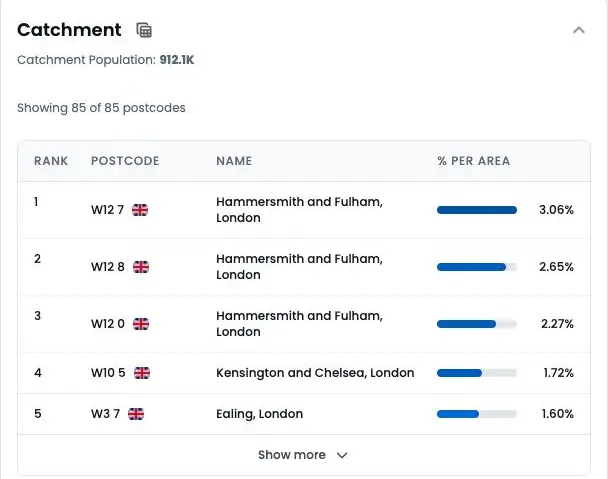
02
Catchment reach
Postcodes that feed the site, and the travel-time areas they fall in.
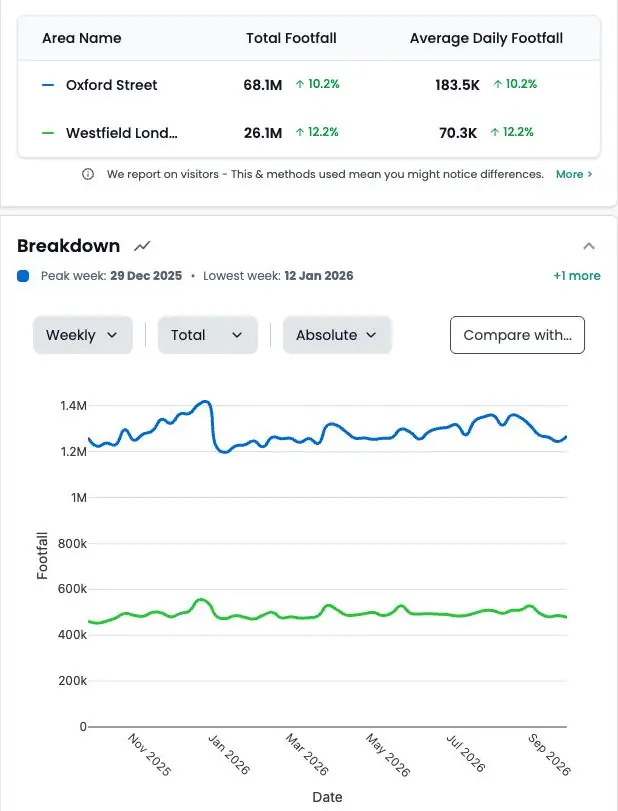
03
Site against its centre
The site's footfall trend set against its high street, shopping centre or retail park and nearby competitors.
Retail site analytics for any UK address
Huq covers any address in the UK: high streets, shopping centres, retail parks, competitors' stores and sites you haven't opened yet. No counters, sensors or cameras needed.
Huq manually validates more than 1,000 locations in each of its 35 markets twice a year, and data refreshes weekly.
How it works
Step 1
Tell us your locations
Add up to five addresses in the form. Your own stores, candidate sites or competitors.
Step 2
We run the analysis
Our team maps each location from observed visitor data.
Step 3
We walk you through it
A short call to take you through what the data shows and what it means for you.
Why UK retailers use Huq for retail site analytics
- Huq publishes its accuracy by country: an 18.7% median error in Great Britain against landlord-reported footfall.
- JD Sports, a UK retailer, got 25% more precise catchment analysis and 18% lower new-store location risk.
- Ripon BID saw footfall up 164% year on year.
- Trusted by 300+ organisations across 35 markets, including the global insights, research and location intelligence teams at Nike, Adidas, JD Sports and Samsung.
huq's platform gave us valuable data to support a key decision on potential new sites.
Dan Brogden
National Sales Manager, Puccinos
Who it's for
01
Retail chains of any size
From five-store retailers planning their next site to global brands: choose locations, track store performance and benchmark against competitors.
02
Retail property owners
Show centre performance, support leasing and get the tenant mix right, for landlords, asset managers and brokers.
03
Investors and private equity
Check how retail brands and assets actually perform before you buy, and monitor them after.
Everything Huq measures, in one platform
- Footfall: by week, month and year, with totals, average daily footfall, trends, period-on-period change, and visiting vs passing traffic.
- Residents and visitors.
- Catchment and travel time: catchment by postcodes, plus drive-time and travel-time analysis.
- Demographics and profiling: age, gender and purchasing power.
- Behaviour: visit frequency, dwell time, time of day and dayparts, cross-visitation between up to 10 location pairs, and international visitation for tourism.
- Footfall density and transportation mode.
- Places, brands and industries: points of interest, brand locations and brand analysis, industry performance, shopping centre and retail centre types.
- Geo-spend: spend by volume and category at any UK location, via Experian.
- Tools: the Explore map (draw any area or use layers for travel time, catchment, shopping centres, retail centres, brand locations, industries and postcodes), White Space Analysis, and Projects for monitoring many locations and reporting to stakeholders.
- Delivery: the platform, CSV or Excel exports, monthly PDF location reports, and data feeds as Parquet and CSV files into Amazon S3 or Google Cloud Storage buckets.
- Cadence: data refreshes weekly.
Frequently asked questions
How do you analyse a retail site?
Start with footfall and its trend, then look at who the site serves: catchment, dwell, dayparts and visit frequency. Compare all of it with nearby competitors and the wider high street or centre. Finally, set the results against your own sales to see whether the site or the store is the issue.
What is the difference between site analytics and store analytics?
Site analytics focuses on the location: how busy it is, who it draws and how it compares with its surroundings, which also works for units you don't trade from yet. Store analytics adds your own trading view, setting those outside measures against sales and POS data for stores you run.
Can I check a vacant unit before signing?
Yes. Huq needs no hardware, so you can draw any UK unit on the Explore map and see its footfall, catchment, demographics and nearby competitors before you sign. As Dan Brogden, National Sales Manager at Puccinos, put it: "huq's platform gave us valuable data to support a key decision on potential new sites."
How often does the footfall data update?
Huq data refreshes weekly. You can view footfall by week, month and year, and monthly PDF location reports summarise the site's KPIs, weekday patterns, dwell and catchment against regional and national benchmarks.
Which UK sites does Huq cover?
Any address in the UK: high street units, shopping centres, retail parks, competitors' stores and sites you haven't opened yet. Huq manually validates more than 1,000 locations in each of its 35 markets twice a year.
What do I get in the free analysis?
Send us one or more sites and we'll return a free analysis of your portfolio, covering footfall trend, catchment and local competition, so you can judge the data on places you know.
Questions? Talk to us
Book a demoAbout Huq
Huq is a location intelligence company. We turn anonymised mobile location data into footfall, catchment and visitor insight for any place, so retailers, property owners and local authorities can make decisions on evidence.
See how your locations really perform
Up to 5 locations. No cost, no commitment.