.svg)
Most teams searching for a Placer alternative have locations in the UK, Europe or the Middle East and need a panel that actually reaches them. Huq measures real visits across 22 markets. Enter an address and see what a site does.





%201.avif)





Expansion plans stall the moment the evidence stops at a border and someone has to argue by analogy instead. Teams looking at Placer alternatives are usually already mid rollout. Huq measures visits across 22 markets, from the UK and Ireland through Europe to the Middle East and the USA.
01
The countries on your opening plan are already measured. Enter an address in any of 22 markets and the history is there today, not on a roadmap.
02
Assuming a London site will behave like a Chicago one is how expansion capital gets burned. Anyone weighing Huq against Placer is usually about to commit somewhere new, so measure the actual street first.
03
Anonymised, aggregated, and processed in line with GDPR and local privacy regulations. A privacy review is where international rollouts stall, so the answer is ready before the question is put.
Anonymised, aggregated, and processed in line with GDPR and local privacy regulations. A privacy review is where international rollouts stall, so the answer is ready before the question is put.
01
A high street in Madrid, a retail park outside Dublin, a mall in Dubai. If it sits inside the 22 markets Huq covers, it can be measured today.
02
Real visits are counted from a single large, anonymised mobility panel spanning all 22 markets, so an unfamiliar country reads like your home one.
03
Visit counts, peak hours and seasonality with years of history behind them, so a new market is sized on what happened, not on a projection.
04
Where visitors travel from, how far they come and where else they go, which is how you separate a genuine catchment from a passing trade location.
05
Export the evidence and set overseas sites beside domestic ones in one table, so the board reads a single set of numbers instead of two.
01. Bewegung
Wie viele Menschen kommen und woher sie anreisen.
02. Menschen
Alter, Geschlecht und Einkommen der Besucher.
03. Verhalten
Wie lange sie bleiben und wie oft sie wiederkommen.
04. Wert
Ausgaben am Standort und nach Kategorie.
05. Rhythmus
Wann die Frequenz entsteht, nach Stunde und Wochentag.
06. Kontext
Jedes Gebiet im Vergleich zu Ihrem Netz und zum Wettbewerb.
Australien, Belgien, Frankreich, Deutschland, Vereinigtes Königreich, Irland, Italien, Japan, Mexiko, Marokko, Niederlande, Polen, Portugal, Katar, Saudi-Arabien, Südkorea, Spanien, Schweiz, VAE, USA
Visualisieren Sie dichte Füßgängerströme im Stadtraum. Erkennen Sie Spitzenzeiten und gewohnte Wege mit 5 Metern Genauigkeit.
Bewegungs-, Demografie-, Ausgaben- und Kontextdaten in einer einheitlichen Ansicht für Location Intelligence.
Ein Workflow-Tool, mit dem Sie Expansion, Portfolio und Gebietsmonitoring nachverfolgen.
Name a city you are considering and we will pull the footfall picture live on the call. If you already run Placer across a US estate, bring one of those sites too and look at both together.

More than 300 organisations use Huq, from retailers opening their first units overseas to landlords and public bodies who need one evidence standard in every country they operate in.
.avif)
„Die Daten von huq waren für uns ein Wendepunkt. Die Einblicke in Frequenz und Besucherverhalten haben uns die Klarheit gegeben, unsere Retail-Strategie zu optimieren und fundierte Entscheidungen zu treffen.“
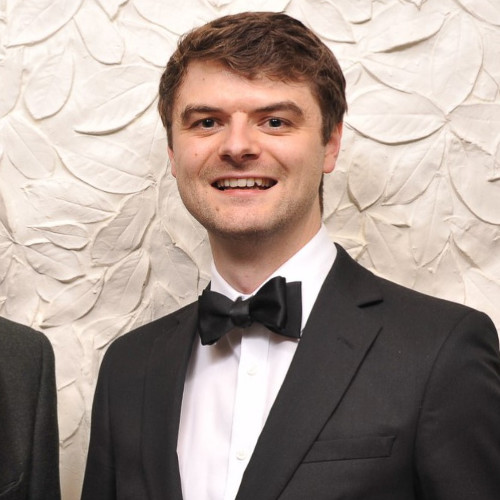
Tom Haydney
UK Marketing & Product Manager
Kawai
Die Mobilitätsdaten von huq helfen uns, bessere Investitionsentscheidungen zu treffen und Risiken im Sinne unserer Anleger angemessen zu steuern.
%201.avif)
Jonathan Bayfield
Head of UK Real Estate Research
Aviva Investors
Die Plattform von huq lieferte uns wertvolle Daten für eine wichtige Entscheidung über mögliche neue Standorte.

Dan Brogden
National Sales Manager
Puccinos
What comes up once location tooling stops at a border.
.svg)
Wir geben strategischen Teams die genaueste und zugänglichste Location Intelligence der Welt.
Kontakt

.svg)