.svg)
Test any address before you commit. See footfall, catchment and competitor overlap for every site on your shortlist, in minutes. No hardware, no six-week study.





%201.avif)





Huq measures real visits across 22 markets, so every location on your shortlist is scored on evidence rather than a broker's floorplan and a gut feel.
01
No consultancy brief, no six-week wait. Enter each address and get footfall, catchment and visitor profile on the spot.
02
A lease is a decade of rent committed on a few weeks of evidence. Test the assumption before heads of terms, not after the first quarter of trading.
03
Put every candidate site in one table on the same measure, so the committee compares like with like instead of five differently argued decks.
Put every candidate site in one table on the same measure, so the committee compares like with like instead of five differently argued decks.
01
Enter every address on the shortlist, plus the sites you already run and the competitors nearby. All 22 markets are open from the start.
02
Visit counts for each location, day by day, drawn from a large anonymised mobility panel rather than a manual count or a broker estimate.
03
See where visitors travel from, how far they come and how big the genuine catchment is, not the radius someone drew on a map.
04
Find out which competitors share your shoppers and whether a new site would cannibalise one you already trade from.
05
Export the comparison and hand the board one like-for-like table, with years of history behind every number.
01. Spostamenti
Quante persone arrivano e da dove provengono.
02. Profili
Età, genere e reddito di chi frequenta il luogo.
03. Comportamento
Quanto si fermano e ogni quanto tornano.
04. Valore
La spesa sul posto e per categoria.
05. Ritmo
Quando si genera l'affluenza, per ora e giorno della settimana.
06. Contesto
Qualsiasi area a confronto con la tua rete e con i concorrenti.
Australia, Belgio, Francia, Germania, Regno Unito, Irlanda, Italia, Giappone, Messico, Marocco, Paesi Bassi, Polonia, Portogallo, Qatar, Arabia Saudita, Corea del Sud, Spagna, Svizzera, Emirati Arabi Uniti, Stati Uniti
Visualizza i flussi pedonali più densi in tutta la città. Individua le ore di punta e i percorsi abituali con una precisione di 5 metri.
Dati di movimento, demografici, di spesa e di contesto in un'unica vista pensata per la location intelligence.
Uno strumento di gestione per seguire espansione, portafoglio e monitoraggio delle aree.
Book a demo and we will pull the footfall and catchment for one of the sites you are considering, live on the call.

Retailers, hospitality brands and landlords use Huq to back the openings worth making and drop the ones that aren't, early enough to matter.
.avif)
«I dati di huq hanno cambiato le regole del gioco per noi. La visibilità su affluenza e comportamento dei visitatori ci ha dato la chiarezza necessaria per ottimizzare la strategia retail e decidere con cognizione di causa.»
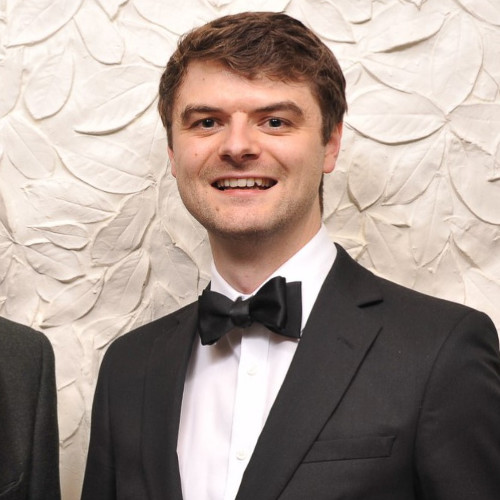
Tom Haydney
UK Marketing & Product Manager
Kawai
I dati di mobilità di huq ci aiutano a prendere decisioni di investimento migliori e a gestire il rischio per conto dei nostri clienti investitori.
%201.avif)
Jonathan Bayfield
Head of UK Real Estate Research
Aviva Investors
La piattaforma di huq ci ha fornito dati preziosi a supporto di una decisione importante su possibili nuove sedi.

Dan Brogden
National Sales Manager
Puccinos
What expansion and property teams ask before committing to a location.
.svg)
Diamo ai team strategici la location intelligence più accurata e accessibile al mondo.

.svg)